Funnel View
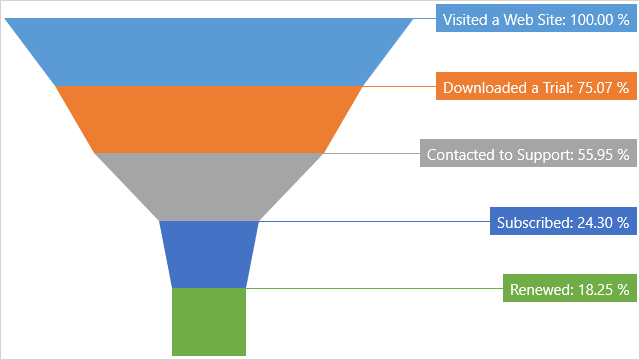
The Funnel series view is used to compare the percentage values of different point arguments in the same series and determine which point value(s) in the point series is (are) the most significant.
Typically, a Funnel series view displays a wide area at the top, indicating the total points’ value, while other areas are proportionally smaller.
An example of the Funnel View chart is shown in the image below.