XYDiagram3D.BarDistance Property
Gets or sets the variable distance value (as a fraction of axis units) between two bars of different 3D Bar Series shown at the same argument point.
Namespace: DevExpress.Xpf.Charts
Assembly: DevExpress.Xpf.Charts.v18.2.dll
Declaration
Property Value
| Type | Description |
|---|---|
| Double | A Double value that represents the distance between two neighboring bars as a fraction of axis units, where an axis unit is the distance between two major values on the axis. |
Remarks
The BarDistance property is introduced by the XYDiagram3D class, to synchronize it in all 3D Side-by-Side Bar series which are present in a chart.
The BarDistance property specifies the distance between two bars in a 3D Side-by-Side Bar Series. This property’s value is given as a fraction, allowing the distance to be automatically resized when the size of the chart is changed. For instance, if the BarDistance property is set to 0.5, then the distance between the two bars will be always equal to half the range between the two major values on the axis.
To specify the distance between two bars in pixels, use the XYDiagram3D.BarDistanceFixed property. If both the BarDistance and XYDiagram3D.BarDistanceFixed properties are in effect at the same time, their values are summed as constant and variable distances.

Example
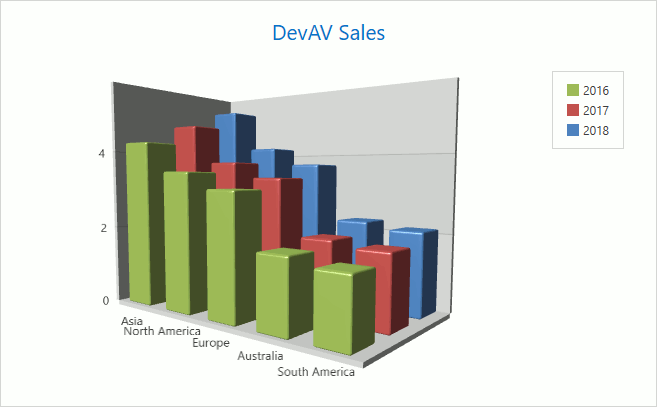
This example demonstrates how to create a 3D Manhattan Bar chart.
Create a ChartControl and specify its ChartControl.Diagram property to a XYDiagram3D object.
Note
Note that the ChartControl.Diagram is a content property. You can declare a diagram in XAML directly after a chart control’s declaration and not wrap it in opening and closing ChartControl.Diagram tags.
Add a BarSeries3D object to the Diagram.Series collection.
Note
Note that the Diagram.Series is a content property. You can declare series in XAML directly after a diagram’s declaration and not wrap it in opening and closing Diagram.Series tags.
Use the following properties to bind the series to data:
- Series.DataSource - Specifies the series’s data source.
- Series.ArgumentDataMember - Defines the data member that provides the series’s arguments.
- Series.ValueDataMember - Specifies the data member that provides the series’s values.
Note
A complete sample project is available at https://github.com/DevExpress-Examples/how-to-create-a-3d-manhattan-bar-chart-e1694.
<Window x:Class="ManhattanBar3DChart.Window1"
        xmlns:local="clr-namespace:ManhattanBar3DChart"
        xmlns="http://schemas.microsoft.com/winfx/2006/xaml/presentation"
        xmlns:x="http://schemas.microsoft.com/winfx/2006/xaml"
        xmlns:dxc="http://schemas.devexpress.com/winfx/2008/xaml/charts"
        Title="Main Window" Height="492" Width="851.5">
    <Grid>
        <dxc:ChartControl Name="chartControl1">
            <dxc:ChartControl.DataContext>
                <local:DevAVSalesByYear/>
            </dxc:ChartControl.DataContext>
            <dxc:XYDiagram3D BarDistance="0.3"
                             BarDistanceFixed="5"
                             SeriesDistance="1"
                             ZoomPercent="140"
                             HorizontalScrollPercent="-10"
                             VerticalScrollPercent="10">
                <dxc:XYDiagram3D.ContentTransform>
                    <MatrixTransform3D>
                        <MatrixTransform3D.Matrix>
                            <Matrix3D M11="0.82" M12="-0.06" M13="0.575" M14="0"
                                      M21="0.01" M22="1" M23="0.089" M24="0"
                                      M31="-0.578" M32="-0.067" M33="0.813" M34="0"
                                      M44="1"
                                      OffsetZ="0" OffsetX="0" OffsetY="0"/>
                        </MatrixTransform3D.Matrix>
                    </MatrixTransform3D>
                </dxc:XYDiagram3D.ContentTransform>
                <dxc:BarSeries3D
                        x:Name="series1"
                        DisplayName="{Binding Series1DisplayName}"
                        DataSource="{Binding Series1Source}"
                        ArgumentDataMember="Region"
                        ValueDataMember="Sales"/>
                <dxc:BarSeries3D
                        x:Name="series2"
                        DisplayName="{Binding Series2DisplayName}"
                        DataSource="{Binding Series2Source}"
                        ArgumentDataMember="Region"
                        ValueDataMember="Sales"/>
                <dxc:BarSeries3D
                        x:Name="series3"
                        DisplayName="{Binding Series3DisplayName}"
                        DataSource="{Binding Series3Source}"
                        ArgumentDataMember="Region"
                        ValueDataMember="Sales"/>
            </dxc:XYDiagram3D>
            <dxc:ChartControl.Legends>
                <dxc:Legend
                    HorizontalPosition="Right"
                    ReverseItems="True" />
            </dxc:ChartControl.Legends>
            <dxc:ChartControl.Titles>
                <dxc:Title Content="DevAV Sales"
                           Dock="Top"
                           HorizontalAlignment="Center"/>
            </dxc:ChartControl.Titles>
        </dxc:ChartControl>
    </Grid>
</Window>
Related GitHub Examples
The following code snippet (auto-collected from DevExpress Examples) contains a reference to the BarDistance property.
Note
The algorithm used to collect these code examples remains a work in progress. Accordingly, the links and snippets below may produce inaccurate results. If you encounter an issue with code examples below, please use the feedback form on this page to report the issue.