ManualDateTimeScaleOptions.AutoGrid Property
Gets or sets a value that specifies whether the spacing of grid lines is calculated automatically based upon the major tickmarks of the axis.
Namespace: DevExpress.Xpf.Charts
Assembly:
DevExpress.Xpf.Charts.v21.2.dll
NuGet Package:
DevExpress.Wpf.Charts
Declaration
public bool AutoGrid { get; set; }
Public Property AutoGrid As Boolean
Property Value
| Type |
Description |
| Boolean |
true, if grid spacing is performed automatically; otherwise, false.
|
The AutoGrid property is tightly interrelated to the ManualDateTimeScaleOptions.GridSpacing property. Changing the value of one property affects the other. By default, the AutoGrid property is set to true and the grid line spacing is calculated automatically.
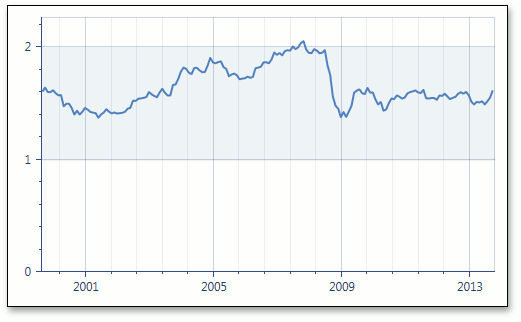
The following images demonstrate how the AutoGrid property works.
AutoGrid = true,
GridSpacing=4
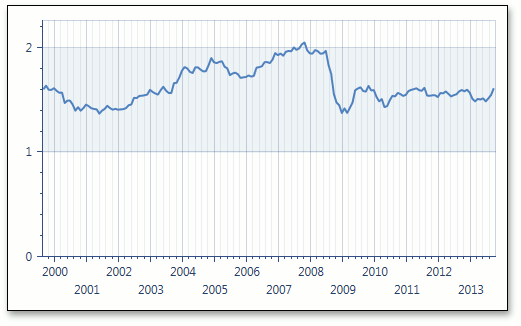
| AutoGrid = false,
GridSpacing=1
|
|---|
| 
|
Example
This example demonstrates how to use the manual date-time scale options of the X-axis.
Data aggregation is enabled automatically for the date-time scale on the X-axis in both automatic and manual scale options.
When the AxisX2D.DateTimeScaleOptions property is set to ManualDateTimeScaleOptions, you can define the ManualDateTimeScaleOptions.GridAlignment, ManualDateTimeScaleOptions.MeasureUnit and ManualDateTimeScaleOptions.AggregateFunction properties manually.
To use the automatic date-time scale options, set the AxisX2D.DateTimeScaleOptions property to AutomaticDateTimeScaleOptions, and select the appropriate AutomaticDateTimeScaleOptions.AggregateFunction.
To prevent the axis scale from being divided into intervals (and thus prevent chart data from being aggregated), set the ManualDateTimeScaleOptions.AggregateFunction property to None.
View Example
<Window
        xmlns="http://schemas.microsoft.com/winfx/2006/xaml/presentation"
        xmlns:x="http://schemas.microsoft.com/winfx/2006/xaml"
        xmlns:dxc="http://schemas.devexpress.com/winfx/2008/xaml/charts"
        x:Class="WpfApplication19.MainWindow"
        Title="MainWindow" Height="400" Width="525">
    <Grid>
        <dxc:ChartControl>
            <dxc:XYDiagram2D >
                <dxc:XYDiagram2D.AxisX>
                    <dxc:AxisX2D GridLinesMinorVisible="True" GridLinesVisible="True">
                        <dxc:AxisX2D.DateTimeScaleOptions>
                            <dxc:ManualDateTimeScaleOptions AggregateFunction="Maximum" AutoGrid="False"
                                                            GridAlignment="Year" MeasureUnit="Month"
                                                            GridSpacing="3" GridOffset="1"/>
                        </dxc:AxisX2D.DateTimeScaleOptions>
                    </dxc:AxisX2D>
                </dxc:XYDiagram2D.AxisX>
                <dxc:LineSeries2D DataSource="{Binding Path=Rate}"
                                  ArgumentDataMember="Argument" ValueDataMember="Value"  />
            </dxc:XYDiagram2D>
        </dxc:ChartControl>
    </Grid>
</Window>
Imports Microsoft.VisualBasic
Imports System
Imports System.Collections.Generic
Imports System.Globalization
Imports System.Windows
Imports System.Windows.Resources
Imports System.Xml.Linq

Namespace WpfApplication19

    Partial Public Class MainWindow
        Inherits Window
        Public Sub New()
            InitializeComponent()
            DataContext = New MyModel()
        End Sub
    End Class

    Public Class DateTimePoint
        Private value_Renamed As Double
        Private argument_Renamed As DateTime

        Public ReadOnly Property Value() As Double
            Get
                Return value_Renamed
            End Get
        End Property

        Public ReadOnly Property Argument() As DateTime
            Get
                Return argument_Renamed
            End Get
        End Property

        Public Sub New(ByVal argument As DateTime, ByVal value As Double)
            Me.argument_Renamed = argument
            Me.value_Renamed = value
        End Sub
    End Class

    Public Class MyModel
        Private rate_Renamed As New List(Of DateTimePoint)()

        Public ReadOnly Property Rate() As List(Of DateTimePoint)
            Get
                Return rate_Renamed
            End Get
        End Property


        Public Sub New()

            LoadPoints(rate_Renamed, LoadFromFile("/GbpUsdRate.xml"))
        End Sub

        Private Function LoadFromFile(ByVal xmlFile As String) As XDocument
            Return LoadXmlFromResources(xmlFile)
        End Function

        Public Shared Function LoadXmlFromResources(ByVal fileName As String) As XDocument

            Try
                fileName = "/WpfApplication19;component" & fileName
                Dim uri As New Uri(fileName, UriKind.RelativeOrAbsolute)
                Dim info As StreamResourceInfo = Application.GetResourceStream(uri)
                Return XDocument.Load(info.Stream)
            Catch
                Return Nothing
            End Try
        End Function

        Private Sub LoadPoints(ByVal rate As List(Of DateTimePoint), ByVal document As XDocument)
            If rate IsNot Nothing AndAlso document IsNot Nothing Then
                For Each element As XElement In document.Descendants("CurrencyRate")
                    Dim argument As DateTime = DateTime.Parse(element.Element("DateTime").Value)
                    Dim value As Double = Double.Parse(element.Element("Rate").Value, CultureInfo.InvariantCulture)
                    rate.Add(New DateTimePoint(argument, value))
                Next element
            End If
        End Sub
    End Class
End Namespace
using System;
using System.Collections.Generic;
using System.Globalization;
using System.Windows;
using System.Windows.Resources;
using System.Xml.Linq;

namespace WpfApplication19
{

    public partial class MainWindow : Window
    {
        public MainWindow()
        {
            InitializeComponent();
            DataContext = new MyModel();
        }
    }

    public class DateTimePoint
    {
        double value;
        DateTime argument;

        public double Value
        {
            get { return value; }
        }

        public DateTime Argument
        {
            get { return argument; }
        }

        public DateTimePoint(DateTime argument, double value)
        {
            this.argument = argument;
            this.value = value;
        }
    }

    public class MyModel
    {
        List<DateTimePoint> rate = new List<DateTimePoint>();

        public List<DateTimePoint> Rate
        {
            get { return rate; }
        }


        public MyModel()
        {

            LoadPoints(rate, LoadFromFile("/GbpUsdRate.xml"));
        }

        XDocument LoadFromFile(string xmlFile)
        {
            return LoadXmlFromResources(xmlFile);
        }

        public static XDocument LoadXmlFromResources(string fileName)
        {

            try
            {
                fileName = "/WpfApplication19;component" + fileName;
                Uri uri = new Uri(fileName, UriKind.RelativeOrAbsolute);
                StreamResourceInfo info = Application.GetResourceStream(uri);
                return XDocument.Load(info.Stream);
            }
            catch
            {
                return null;
            }
        }

        void LoadPoints(List<DateTimePoint> rate, XDocument document)
        {
            if (rate != null && document != null)
            {
                foreach (XElement element in document.Descendants("CurrencyRate"))
                {
                    DateTime argument = DateTime.Parse(element.Element("DateTime").Value);
                    double value = double.Parse(element.Element("Rate").Value, CultureInfo.InvariantCulture);
                    rate.Add(new DateTimePoint(argument, value));
                }
            }
        }
    }
}
See Also