Snoop
- 4 minutes to read
Snoop is a free utility that you can use to inspect and debug your application. You can download this tool from the repository Releases section. This article describes the Snoop features and functionality.
To get started, run Snoop.exe and the application you want to inspect. The Snoop window contains a bar with multiple buttons. To attach Snoop to your application, drop the Crosshair button on the application’s window. You can also select the application in ComboBox and click the Binoculars button.

The invoked window displays a visual tree hierarchy and debug information (for example, property values, raised events, and the current focused element).

If the window does not appear, try to run Snoop as Administrator.
Press Ctrl + Shift and hover over the element to inspect it. Snoop highlights this element in the visual tree and displays information about the element in the detailed view. If you want to skip template parts, press Ctrl + Alt instead.
Snoop allows you to complete the following tasks:
Bind a Control to Data
If a binding source is not set explicitly, the data context specifies the default source. To identify the target element’s data context, select the element in the visual tree and switch to the Data Context tab.
For example, you need to display a value from the data source in the TextBox element.
<TextBlock Text="{Binding Path=???}"/>
The element’s Data Context tab contains the Id and Name properties:

Bind the TextBlock’s Text property to ID or Name as follows:
<TextBlock Text="{Binding Path=Name}"/>
Bind a Control to the Element
Inspect the visual tree to determine the parent element that you should bind to your control and specify the element’s type as AncestorType. For example, if you want to display the Window‘s title in the TextBlock, you can bind the TextBlock to the Window as follows:
<Window x:Class="SnoopExample.MainWindow"
        xmlns="http://schemas.microsoft.com/winfx/2006/xaml/presentation"
        xmlns:x="http://schemas.microsoft.com/winfx/2006/xaml"
        xmlns:local="clr-namespace:SnoopExample"
        Title="WindowTitle">
    <Grid>
        <TextBlock Text="{Binding RelativeSource={RelativeSource AncestorType=local:MainWindow}, Path=Title}"/>
    </Grid>
</Window>

Set a Property Value at Runtime
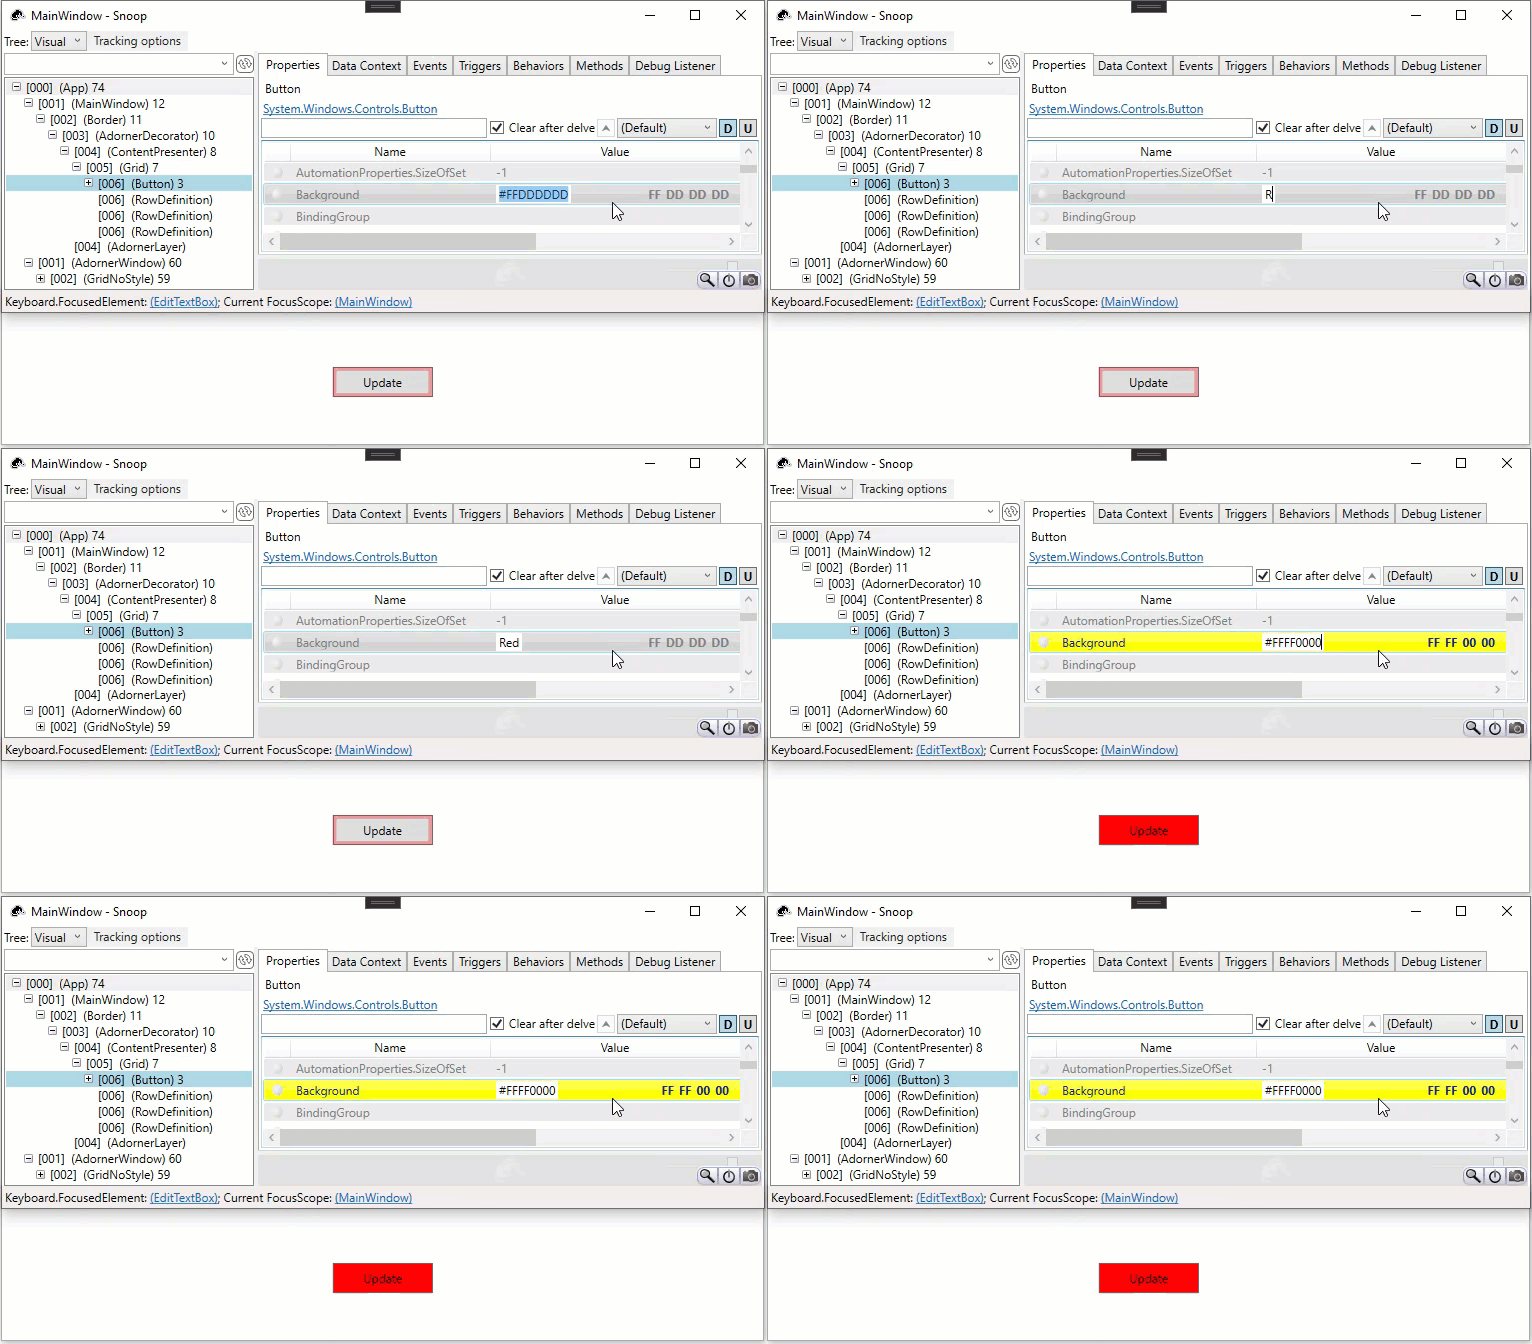
Navigate to the Properties tab to inspect the selected element’s properties. Snoop allows you to change properties values at runtime. For example, you can set the button’s Background property to Red and examine how it affects the application’s appearance.

Examine a Property Value Source
Inspect the Value Source column in the Properties tab to check whether you can change the property’s value. For example, if the element’s Style property has the Default value, you can apply an implicit style to this element. Otherwise, the Style property is already set with a higher priority and the implicit style does not affect the element’s appearance.
Get the Focused Element
Snoop displays the focused element in the lower left corner. Click the link to navigate to this element in the visual tree. If you implement the Tab navigation in your application, you can use Snoop to identify the element that gets focus after you press Tab.

Track Routed Events
The Events tab contains a list of events that you track. Use the ComboBox to add new events to this list. When the event occurs, it appears in the list highlighted in green. You can inspect the control that handled this event.
For example, you define a button in the Grid and a MouseDown event handler at the Grid level. When you click the button, the TextBlock raises the MouseDown event that travels up the visual tree. The Button handles this event and, as a result, the defined event handler is not invoked.
<Grid MouseDown="Grid_MouseDown">
    <Button/>
</Grid>

Refer to the following topic for more information on events: WPF Routed Events.
Set a Breakpoint
Snoop allows you to set a breakpoint to the property setter when you run the application under Visual Studio. To do this, find the target control in the visual tree and click the round button to the right of the property. When execution pauses at the breakpoint, you can examine the call stack in Visual Studio. Disable the Just My Code option in Visual Studio to inspect calls to non-user code.

Invoke a Method
Switch to the Methods tab to invoke a method. For example, you might need to compare two objects in different DataContexts. To do that, select the element in visual tree and navigate to the Methods tab. Set the target object to the DataContext property. Select the GetHashCode method and click Invoke. The result value is displayed below the Invoke button. Repeat the same actions to get another element’s hash code, and compare the results.

Get the Element’s Preview
Select an element in the visual tree and click the Preview button to inspect the element’s appearance. Travel up the visual tree to relate the element’s parts with the application levels that render them.
