Customize Series Appearance
- 3 minutes to read
After series are populated with data, you should specify how your data should be visualized.
The series view defines the form in which the data set is visualized. The Series3DBase.View property configures the view of a series. The Chart3D control is shipped with the following series views.
Bars
This view displays data as individual bars. The series point value defines the bar height.
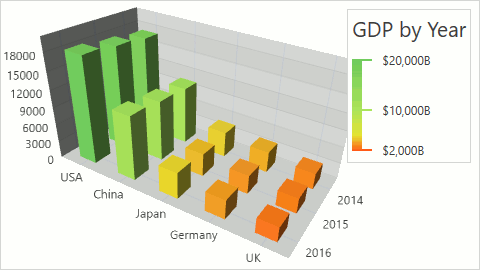
The following XAML configures this view type as shown on image above.
<dxc:Series3D>
    <dxc:Series3D.View>
        <dxc:Bar3DSeriesView EqualBarSize="True">
            <dxc:Bar3DSeriesView.BarModel>
                <dxc:Bar3DBoxPointModel ShowFacets="False"/>
            </dxc:Bar3DSeriesView.BarModel>
        </dxc:Bar3DSeriesView>
    </dxc:Series3D.View>
    <!--Series data here. -->
</dxc:Series3D>
The code above uses the following classes and properties.
| Class or Property | Description |
|---|---|
| Series3DBase.View | The view of a series. |
| Bar3DSeriesView | The 3D Bar series view. |
| Bar3DSeriesView.BarModel | The model of 3D bars. |
| Bar3DSeriesView.EqualBarSize | The value specifying whether the 3D bars should be inscribed in a square. |
Points
This view displays data as stand-alone points.
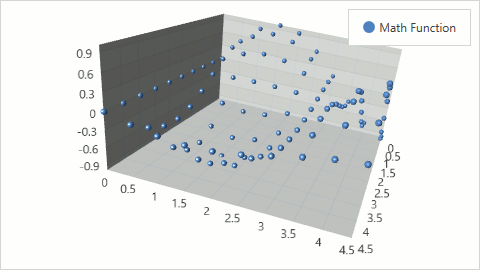
The following XAML configures this view type as shown on image above.
<dxc:Series3D>
    <dxc:Series3D.View>
        <dxc:Point3DSeriesView MarkerSize="25">
            <dxc:Point3DSeriesView.MarkerModel>
                <dxc:Marker3DSpherePointModel SphereDetalizationLevel="Normal"/>
            </dxc:Point3DSeriesView.MarkerModel>
        </dxc:Point3DSeriesView>
    </dxc:Series3D.View>
    <!--Series data here. -->
</dxc:Series3D>
The code above uses the following classes and properties.
| Class or Property | Description |
|---|---|
| Series3DBase.View | The view of a series. |
| Point3DSeriesView | The 3D Point series view. |
| Marker3DSeriesView.MarkerModel | The model of point markers. |
| Point3DSeriesView.MarkerSize | The size of point markers. |
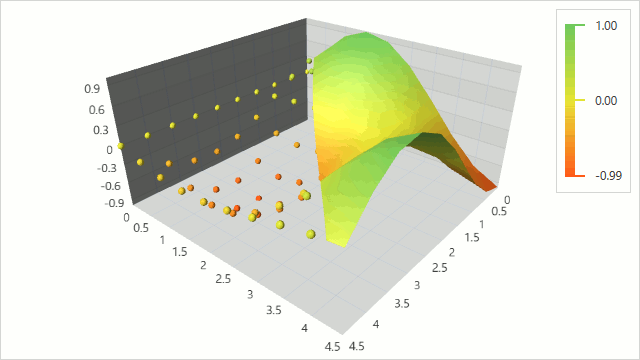
Surface
This view plots a surface passed through all data points.
The following XAML configures this view type as shown on the image above.
<dxc:Series3D>
    <dxc:Series3D.View>
        <dxc:SurfaceSeriesView
            MarkerVisible="True"
            MarkerSize="10">
            <dxc:SurfaceSeriesView.MarkerModel>
                <dxc:Marker3DSpherePointModel SphereDetalizationLevel="Normal"/>
            </dxc:SurfaceSeriesView.MarkerModel>
            <dxc:SurfaceSeriesView.Colorizer>
                <dxc:SolidColorizer3D Brush="Gray"/>
            </dxc:SurfaceSeriesView.Colorizer>
            <dxc:SurfaceSeriesView.FillStyle>
                <dxc:GradientFillStyle
                    LegendTextPattern="{}{V:F1}">
                    <dxc:GradientFillStyle.ColorStops>
                        <dxc:ColorStop Color="#FF6FC85A" Offset="0%"/>
                        <dxc:ColorStop Color="#FFEBE136" Offset="50%"/>
                        <dxc:ColorStop Color="#FFFF6019" Offset="100%"/>
                    </dxc:GradientFillStyle.ColorStops>
                </dxc:GradientFillStyle>
            </dxc:SurfaceSeriesView.FillStyle>
        </dxc:SurfaceSeriesView>
    </dxc:Series3D.View>
    <!--Series data here. -->
</dxc:Series3D>
The code above uses the following classes and properties.
| Class or Property | Description |
|---|---|
| Series3DBase.View | The view of a series. |
| SurfaceSeriesView | The 3D Point series view. |
| Marker3DSeriesView.MarkerModel | The model of point markers. |
| SurfaceSeriesView.MarkerSize | The size of point markers. |
| SurfaceSeriesView.MarkerVisible | The value specifying whether the point markers should be visible |
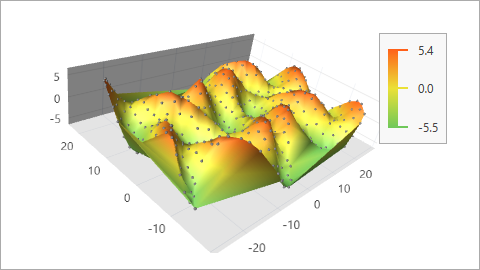
Bubbles
This view displays four-dimensional data using 3D points where the fourth dimension is visualized using the point marker size.
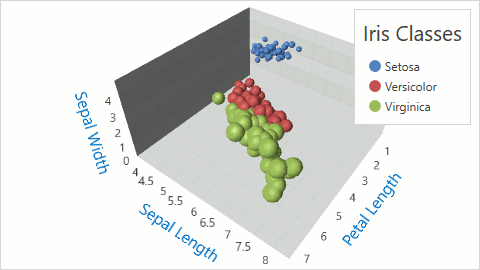
The following XAML configures this view type as shown on the image above.
<dxc:Series3D>
    <dxc:Series3D.View>
        <dxc:Bubble3DSeriesView MinSize="0.3"
                                MaxSize="1.5">
            <dxc:Bubble3DSeriesView.MarkerModel>
                <dxc:Marker3DSpherePointModel SphereDetalizationLevel="Normal"/>
            </dxc:Bubble3DSeriesView.MarkerModel>
        </dxc:Bubble3DSeriesView>
    </dxc:Series3D.View>
    <dxc:SeriesPoint3DDataSourceAdapter DataSource="{Binding Irises}"
                                        XArgumentDataMember="SepalWidth"
                                        YArgumentDataMember="SepalHeight"
                                        ValueDataMember="PetalWidth"
                                        dxc:Bubble3DSeriesView.WeightDataMember="PetalHeight"/>
</dxc:Series3D>
The code above uses the following classes and properties.
| Class or Property | Description |
|---|---|
| Series3DBase.View | The view of a series. |
| Bubble3DSeriesView | The 3D Point series view. |
| Marker3DSeriesView.MarkerModel | The model of point markers. |
| Bubble3DSeriesView.MinSize | Gets or sets the minimum size of bubbles. |
| Bubble3DSeriesView.MaxSize | Gets or sets the maximum size of bubbles. |
Note that data sources support only three-dimensional data by default, therefore this view introduces attached properties that allow you to add the fourth dimension (weight) values in addition to 3D values.
Attached property | Data Source | Description |
|---|---|---|
The weight of an individual series point. | ||
The name of a data member whose values should be used as weight values (bubble sizes) of bubbles. | ||
The array of bubble weights. |