Provide Series Data
- 4 minutes to read
The Chart3DControl can display data specified by one or more series, each series bound to a set of points in three dimensions. When creating a chart, start with series, and then provide data for them.
This document describes how to provide the Chart3D control with data.
- Create Series Automatically from a Template
- Add a Series Manually
- Populate a Series with Unbound Point Data
- Populate Series with Points from a Data Source
- Populate a Series with Points from Arguments and Value Arrays
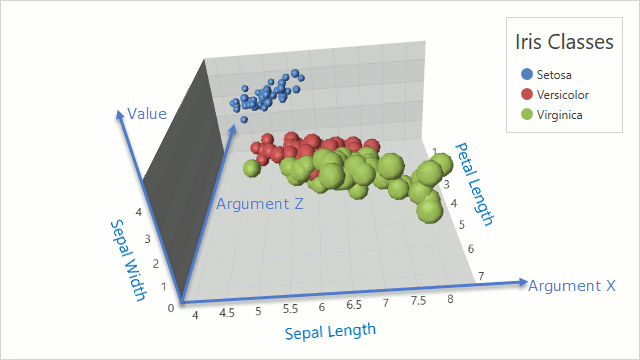
Create Series Automatically from a Template
Use the following XAML to create several series from a data source:
<dxc:Chart3DControl>
    <dxc:Series3DDataSourceAdapter DataSource="{Binding Irises}"
                                   SeriesDataMember="Species"
                                   XArgumentDataMember="SepalLength"
                                   YArgumentDataMember="PetalLength"
                                   ValueDataMember="SepalWidth">
        <dxc:Series3DDataSourceAdapter.SeriesTemplate>
            <dxc:Series3DTemplate>
                <dxc:Series3DTemplate.View>
                    <dxc:Point3DSeriesView/>
                </dxc:Series3DTemplate.View>
            </dxc:Series3DTemplate>
        </dxc:Series3DDataSourceAdapter.SeriesTemplate>
    </dxc:Series3DDataSourceAdapter>
</dxc:Chart3DControl>
The code above uses the following classes and properties:
| Property or Class | Description |
|---|---|
| Chart3DControl.SeriesSource | The Chart3D control’s series source. (Content property) |
| Series3DDataSourceAdapter | Generates series from a data source. |
| Series3DDataSourceAdapter.SeriesTemplate | The series template. |
Note that automatically generated series can be fine-tuned using the Series3DDataSourceAdapter.CustomizeSeries event.
Create Series Manually
The following XAML can be utilized to provide the series to the Chart3D control manually:
<dxc:Chart3DControl>
    <dxc:Series3DStorage>
        <dxc:Series3D/>
    </dxc:Series3DStorage>
</dxc:Chart3DControl>
The code snippet above uses the following classes and members:
| Class or Property | Description |
|---|---|
| Chart3DControl.SeriesSource | The series source of the Chart3D control. (Content property) |
| Series3DStorage | The manually created series’ storage. |
| Series3D | An individual series. |
Create a Series Manually with Unbound Point Data
The series storage allows you to create and configure series points manually if you do not have a data source of arguments and values. The following XAML demonstrates this method:
<dxc:Series3D DisplayName="GDP by Year">
    <dxc:SeriesPoint3DStorage>
        <dxc:SeriesPoint3D XArgument="USA" YArgument="1/1/2014" Value="17348"/>
        <!--Other points.-->
    </dxc:SeriesPoint3DStorage >
</dxc:Series3D >
The following properties and classes are used in the snippets above:
| Class or Property | Description |
|---|---|
| Series3D.PointSource | The source of series’ points. (Content property) |
| SeriesPoint3DStorage | The storage of manually created points. |
| SeriesPoint3DStorage.Points | The collection of manually created points. (Content property) |
| SeriesPoint3D | An individual series point. |
| SeriesPoint3D.XArgument | The X-argument value of the individual series point. |
| SeriesPoint3D.YArgument | The Y-argument value of the individual series point. |
| SeriesPoint3D.Value | The value of the individual series point. |
Create Series Manually with Points from a Data Source
Use the following XAML to populate a series with points generated from an external source:
<dxc:Series3D DisplayName="Population Statistics">
    <dxc:SeriesPoint3DDataSourceAdapter DataSource="{Binding Countries}"
                                        XArgumentDataMember="Name"
                                        YArgumentDataMember="Year"
                                        ValueDataMember="Population"/>
</dxc:Series3D >
The code snippet above uses the following properties and classes:
| Class or Property | Description |
|---|---|
| Series3D.PointSource | The source of series’ points. (Content property) |
| SeriesPoint3DDataSourceAdapter | Generates series points based on the specified data source’s values. |
| SeriesPoint3DDataSourceAdapter.DataSource | The source whose values are used to generate series points. |
| SeriesPoint3DDataSourceAdapter.XArgumentDataMember | The name of the data member whose values are used as X-arguments of points. |
| SeriesPoint3DDataSourceAdapter.YArgumentDataMember | The name of the data member whose values are used as Y-arguments of points. |
| SeriesPoint3DDataSourceAdapter.ValueDataMember | The name of the data member whose values are used as values of points. |
Create Series Manually with Points from Arguments and Value Arrays
Use the following approach to provide data using arrays of X- and Y-arguments and values:
<dxc:Series3D DisplayName="Population Statistics">
    <dxc:SeriesPoint3DMatrixAdapter XArguments="{Binding CountryNames}"
                                    YArguments="{Binding Years}"
                                    Values="{Binding Populations}"/>
</dxc:Series3D >
The code snippet above uses the following properties and classes:
| Class or Property | Description |
|---|---|
| Series3D.PointSource | The source of series’ points. (Content property) |
| SeriesPoint3DMatrixAdapter | Creates series points by the specified arguments and values. |
| SeriesPoint3DMatrixAdapter.XArguments | The X argument values. |
| SeriesPoint3DMatrixAdapter.YArguments | The Y argument values. |
| SeriesPoint3DMatrixAdapter.Values | The values. |
The points are formed using the following principles: for each X argument value, all Y argument values and the required number (the Y arguments count) of values are selected from collections. Use the SeriesPoint3DMatrixAdapter.IsCorrectDimension property to check whether the value collection contains the required number of values to plot the grid.