|
Gray
|
A monochromatic chart style that applies different shades of the Dark1 theme color to each data series.
|
|
GrayOutline
|
A monochromatic chart style that applies different shades of the Dark1 theme color to each data series and specifies shape outlines.
|
|
GrayGradient
|
A monochromatic chart style that applies different shades of the Dark1 theme color with a gradient effect to each data series.
|
|
GrayBevel
|
A monochromatic chart style that applies different shades of the Dark1 theme color to each data series and specifies shape effects (such as beveled edges and shadows).
|
|
GrayArea
|
A monochromatic chart style that applies different shades of the Dark1 theme color to each data series and uses 20% tint of this color to fill the plot area.
|
|
GrayDark
|
A monochromatic chart style that applies different shades of the Dark1 theme color to each data series and uses this color to fill the chart area.
|
|
Color
|
A colorful chart style that applies one of six accent colors defined by the document’s theme to each data series.
|
|
ColorOutline
|
A colorful chart style that applies one of six accent colors to each data series and specifies shape outlines.
|
|
ColorGradient
|
A colorful chart style that applies one of six accent colors with a gradient effect to each data series.
|
|
ColorBevel
|
A colorful chart style that applies one of six accent colors to each data series and specifies shape effects (such as beveled edges and shadows).
|
|
ColorArea
|
A colorful chart style that applies one of six accent colors to each data series and uses 20% tint of the Dark1 theme color to fill the plot area.
|
|
ColorDark
|
A colorful chart style that applies one of six accent colors and shape effects to each data series, and uses the Dark1 theme color to fill the chart area.
|
|
Accent1
|
A monochromatic chart style that applies different shades of the Accent1 theme color to each data series.
|
|
Accent1Outline
|
A monochromatic chart style that applies different shades of the Accent1 theme color to each data series and specifies shape outlines.
|
|
Accent1Gradient
|
A monochromatic chart style that applies different shades of the Accent1 theme color with a gradient effect to each data series.
|
|
Accent1Bevel
|
A monochromatic chart style that applies different shades of the Accent1 theme color to each data series and specifies shape effects (such as beveled edges and shadows).
|
|
Accent1Area
|
A monochromatic chart style that applies different shades of the Accent1 theme color to each data series and uses this color to fill the plot area.
|
|
Accent1Dark
|
A monochromatic chart style that applies different shades of the Accent1 theme color and shape effects to each data series. This style uses the Dark1 theme color to fill the chart area.
|
|
Accent2
|
A monochromatic chart style that applies different shades of the Accent2 theme color to each data series.
|
|
Accent2Outline
|
A monochromatic chart style that applies different shades of the Accent2 theme color to each data series and specifies shape outlines.
|
|
Accent2Gradient
|
A monochromatic chart style that applies different shades of the Accent2 theme color with a gradient effect to each data series.
|
|
Accent2Bevel
|
A monochromatic chart style that applies different shades of the Accent2 theme color to each data series and specifies shape effects (such as beveled edges and shadows).
|
|
Accent2Area
|
A monochromatic chart style that applies different shades of the Accent2 theme color to each data series and uses this color to fill the plot area.
|
|
Accent2Dark
|
A monochromatic chart style that applies different shades of the Accent2 theme color and shape effects to each data series. This style uses the Dark1 theme color to fill the chart area.
|
|
Accent3
|
A monochromatic chart style that applies different shades of the Accent3 theme color to each data series.
|
|
Accent3Outline
|
A monochromatic chart style that applies different shades of the Accent3 theme color to each data series and specifies shape outlines.
|
|
Accent3Gradient
|
A monochromatic chart style that applies different shades of the Accent3 theme color with a gradient effect to each data series.
|
|
Accent3Bevel
|
A monochromatic chart style that applies different shades of the Accent3 theme color to each data series and specifies shape effects (such as beveled edges and shadows).
|
|
Accent3Area
|
A monochromatic chart style that applies different shades of the Accent3 theme color to each data series and uses this color to fill the plot area.
|
|
Accent3Dark
|
A monochromatic chart style that applies different shades of the Accent3 theme color and shape effects to each data series. This chart style uses the Dark1 theme color to fill the chart area.
|
|
Accent4
|
A monochromatic chart style that applies different shades of the Accent4 theme color to each data series.
|
|
Accent4Outline
|
A monochromatic chart style that applies different shades of the Accent4 theme color to each data series and specifies shape outlines.
|
|
Accent4Gradient
|
A monochromatic chart style that applies different shades of the Accent4 theme color with a gradient effect to each data series.
|
|
Accent4Bevel
|
A monochromatic chart style that applies different shades of the Accent4 theme color to each data series and specifies shape effects (such as beveled edges and shadows).
|
|
Accent4Area
|
A monochromatic chart style that applies different shades of the Accent4 theme color to each data series and uses this color to fill the plot area.
|
|
Accent4Dark
|
A monochromatic chart style that applies different shades of the Accent4 theme color and shape effects to each data series. This chart style uses the Dark1 theme color to fill the chart area.
|
|
Accent5
|
A monochromatic chart style that applies different shades of the Accent5 theme color to each data series.
|
|
Accent5Outline
|
A monochromatic chart style that applies different shades of the Accent5 theme color to each data series and specifies shape outlines.
|
|
Accent5Gradient
|
A monochromatic chart style that applies different shades of the Accent5 theme color with a gradient effect to each data series.
|
|
Accent5Bevel
|
A monochromatic chart style that applies different shades of the Accent5 theme color to each data series and specifies shape effects (such as beveled edges and shadows).
|
|
Accent5Area
|
A monochromatic chart style that applies different shades of the Accent5 theme color to each data series and uses this color to fill the plot area.
|
|
Accent5Dark
|
A monochromatic chart style that applies different shades of the Accent5 theme color and shape effects to each data series. This chart style uses the Dark1 theme color to fill the chart area.
|
|
Accent6
|
A monochromatic chart style that applies different shades of the Accent6 theme color to each data series.
|
|
Accent6Outline
|
A monochromatic chart style that applies different shades of the Accent6 theme color to each data series and specifies shape outlines.
|
|
Accent6Gradient
|
A monochromatic chart style that applies different shades of the Accent6 theme color with a gradient effect to each data series.
|
|
Accent6Bevel
|
A monochromatic chart style that applies different shades of the Accent6 theme color to each data series and specifies shape effects (such as beveled edges and shadows).
|
|
Accent6Area
|
A monochromatic chart style that applies different shades of the Accent6 theme color to each data series and uses this color to fill the plot area.
|
|
Accent6Dark
|
A monochromatic chart style that applies different shades of the Accent6 theme color and shape effects to each data series. This chart style uses the Dark1 theme color to fill the chart area.
|
|
Custom
|
A custom chart style. Use the Chart.LoadStyle method to load a custom style from a file.
|
|
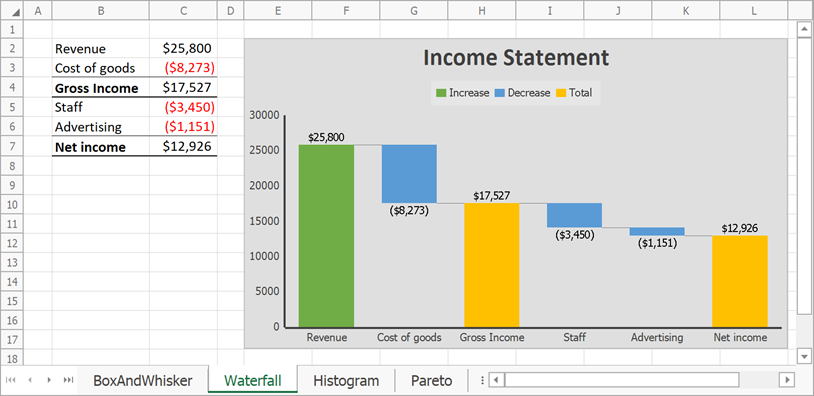
Style1
|
Corresponds to Style 1 from the Chart Styles gallery in Microsoft® Excel® 2016 and higher. Applies to the following chart types: waterfall, box and whisker, histogram, sunburst, funnel, Pareto, and treemap.
|
|
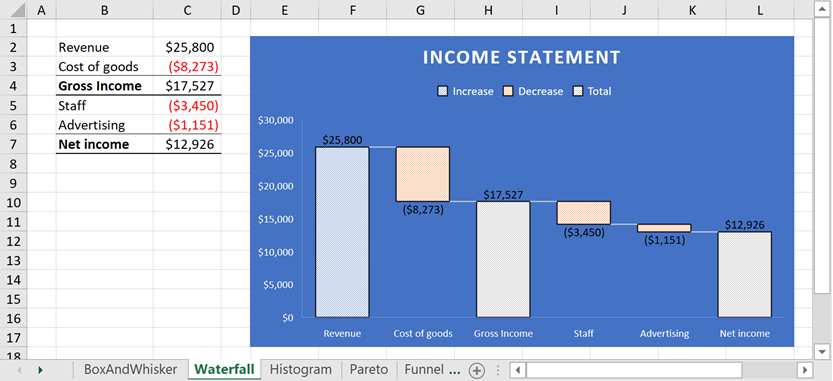
Style2
|
Corresponds to Style 2 from the Chart Styles gallery in Microsoft® Excel® 2016 and higher. Applies to the following chart types: waterfall, box and whisker, histogram, sunburst, funnel, Pareto, and treemap.
|
|
Style3
|
Corresponds to Style 3 from the Chart Styles gallery in Microsoft® Excel® 2016 and higher. Applies to the following chart types: waterfall, box and whisker, histogram, sunburst, funnel, Pareto, and treemap.
|
|
Style4
|
Corresponds to Style 4 from the Chart Styles gallery in Microsoft® Excel® 2016 and higher. Applies to the following chart types: waterfall, box and whisker, histogram, sunburst, funnel, Pareto, and treemap.
|
|
Style5
|
Corresponds to Style 5 from the Chart Styles gallery in Microsoft® Excel® 2016 and higher. Applies to the following chart types: waterfall, box and whisker, histogram, sunburst, funnel, Pareto, and treemap.
|
|
Style6
|
Corresponds to Style 6 from the Chart Styles gallery in Microsoft® Excel® 2016 and higher. Applies to the following chart types: waterfall, box and whisker, histogram, sunburst, funnel, Pareto, and treemap.
|
|
Style7
|
Corresponds to Style 7 from the Chart Styles gallery in Microsoft® Excel® 2016 and higher. Applies to the following chart types: waterfall, sunburst, funnel, and treemap.
|
|
Style8
|
Corresponds to Style 8 from the Chart Styles gallery in Microsoft® Excel® 2016 and higher. Applies to the following chart types: waterfall, sunburst, funnel, and treemap.
|
|
Style9
|
Corresponds to Style 9 from the Chart Styles gallery in Microsoft® Excel® 2016 and higher. Applies to the following chart types: funnel and treemap.
|