ChartObject.ColorPalette Property
Returns or specifies a color palette for the chart. Applies only to Excel 2016 charts.
Namespace: DevExpress.Spreadsheet.Charts
Assembly:
DevExpress.Spreadsheet.v21.1.Core.dll
Declaration
ChartColorPalette ColorPalette { get; set; }
Property ColorPalette As ChartColorPalette
Property Value
| Type |
Description |
| ChartColorPalette |
An enumeration member that specifies the chart’s color palette.
|
Available values:
| Name |
Description |
Example (Office Theme) |
|
Colorful1
|
Tints and shades of the Accent 1 through Accent 6 theme colors.
|

|
|
Colorful2
|
Tints and shades of the Accent 1, Accent 3, and Accent 5 theme colors.
|

|
|
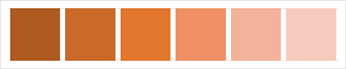
Colorful3
|
Tints and shades of the Accent 2, Accent 4, and Accent 6 theme colors.
|

|
|
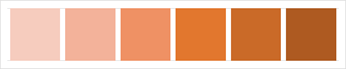
Colorful4
|
Tints and shades of the Accent 6, Accent 5, and Accent 4 theme colors.
|

|
|
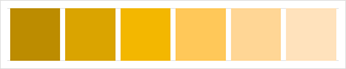
Monochromatic1
|
A gradient of the Accent 1 theme color (dark to light).
|

|
|
Monochromatic2
|
A gradient of the Accent 2 theme color (dark to light).
|
|
|
Monochromatic3
|
A gradient of the Accent 3 theme color (dark to light).
|

|
|
Monochromatic4
|
A gradient of the Accent 4 theme color (dark to light).
|
|
|
Monochromatic5
|
A gradient of the Accent 5 theme color (dark to light).
|

|
|
Monochromatic6
|
A gradient of the Accent 6 theme color (dark to light).
|

|
|
Monochromatic7
|
Tints of the Dark 1 theme color.
|

|
|
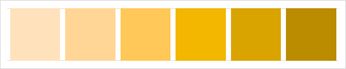
Monochromatic8
|
A gradient of the Accent 1 theme color (light to dark).
|

|
|
Monochromatic9
|
A gradient of the Accent 2 theme color (light to dark).
|
|
|
Monochromatic10
|
A gradient of the Accent 3 theme color (light to dark).
|

|
|
Monochromatic11
|
A gradient of the Accent 4 theme color (light to dark).
|
|
|
Monochromatic12
|
A gradient of the Accent 5 theme color (light to dark).
|

|
|
Monochromatic13
|
A gradient of the Accent 6 theme color (light to dark).
|

|
Use the ColorPalette property to change chart colors. These colors depend on the document theme and change when another theme is applied to the workbook. The ChartObject.Style property defines the chart style (a combination of format options and layout settings).
The example below demonstrates how to create a waterfall chart and specify its colors and style.
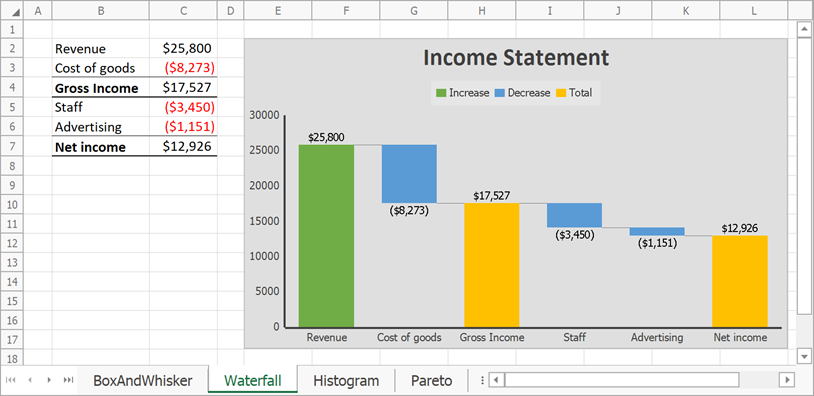
// Create a waterfall chart and specify its location.
Chart chart = worksheet.Charts.Add(ChartType.Waterfall, worksheet["B2:C7"]);
chart.TopLeftCell = worksheet.Cells["E2"];
chart.BottomRightCell = worksheet.Cells["L17"];

// Hide the major gridlines for the value axis.
chart.PrimaryAxes[1].MajorGridlines.Visible = false;

// Specify series options.
var options = chart.Series[0].LayoutOptions.Waterfall;
// Display connector lines.
options.ShowConnectorLines = true;
// Set the third data point as the total.
options.SubtotalDataPoints.Add(2);
// Set the last data point as the total.
options.SubtotalDataPoints.Add(5);

// Specify the chart style.
chart.Style = ChartStyle.Style3;
// Change chart colors.
chart.ColorPalette = ChartColorPalette.Colorful4;

// Add the chart title.
chart.Title.Visible = true;
chart.Title.SetValue("Income Statement");
' Create a waterfall chart and specify its location.
Dim chart As Chart = worksheet.Charts.Add(ChartType.Waterfall, worksheet("B2:C7"))
chart.TopLeftCell = worksheet.Cells("E2")
chart.BottomRightCell = worksheet.Cells("L17")

' Hide the major gridlines for the value axis.
chart.PrimaryAxes(1).MajorGridlines.Visible = False

' Specify series options.
Dim options As WaterfallSeriesOptions = chart.Series(0).LayoutOptions.Waterfall
' Display connector lines.
options.ShowConnectorLines = True
' Set the third data point as the total.
options.SubtotalDataPoints.Add(2)
' Set the last data point as the total.
options.SubtotalDataPoints.Add(5)

' Specify the chart style.
chart.Style = ChartStyle.Style3
' Change chart colors.
chart.ColorPalette = ChartColorPalette.Colorful4

' Add the chart title.
chart.Title.Visible = True
chart.Title.SetValue("Income Statement")
See Also