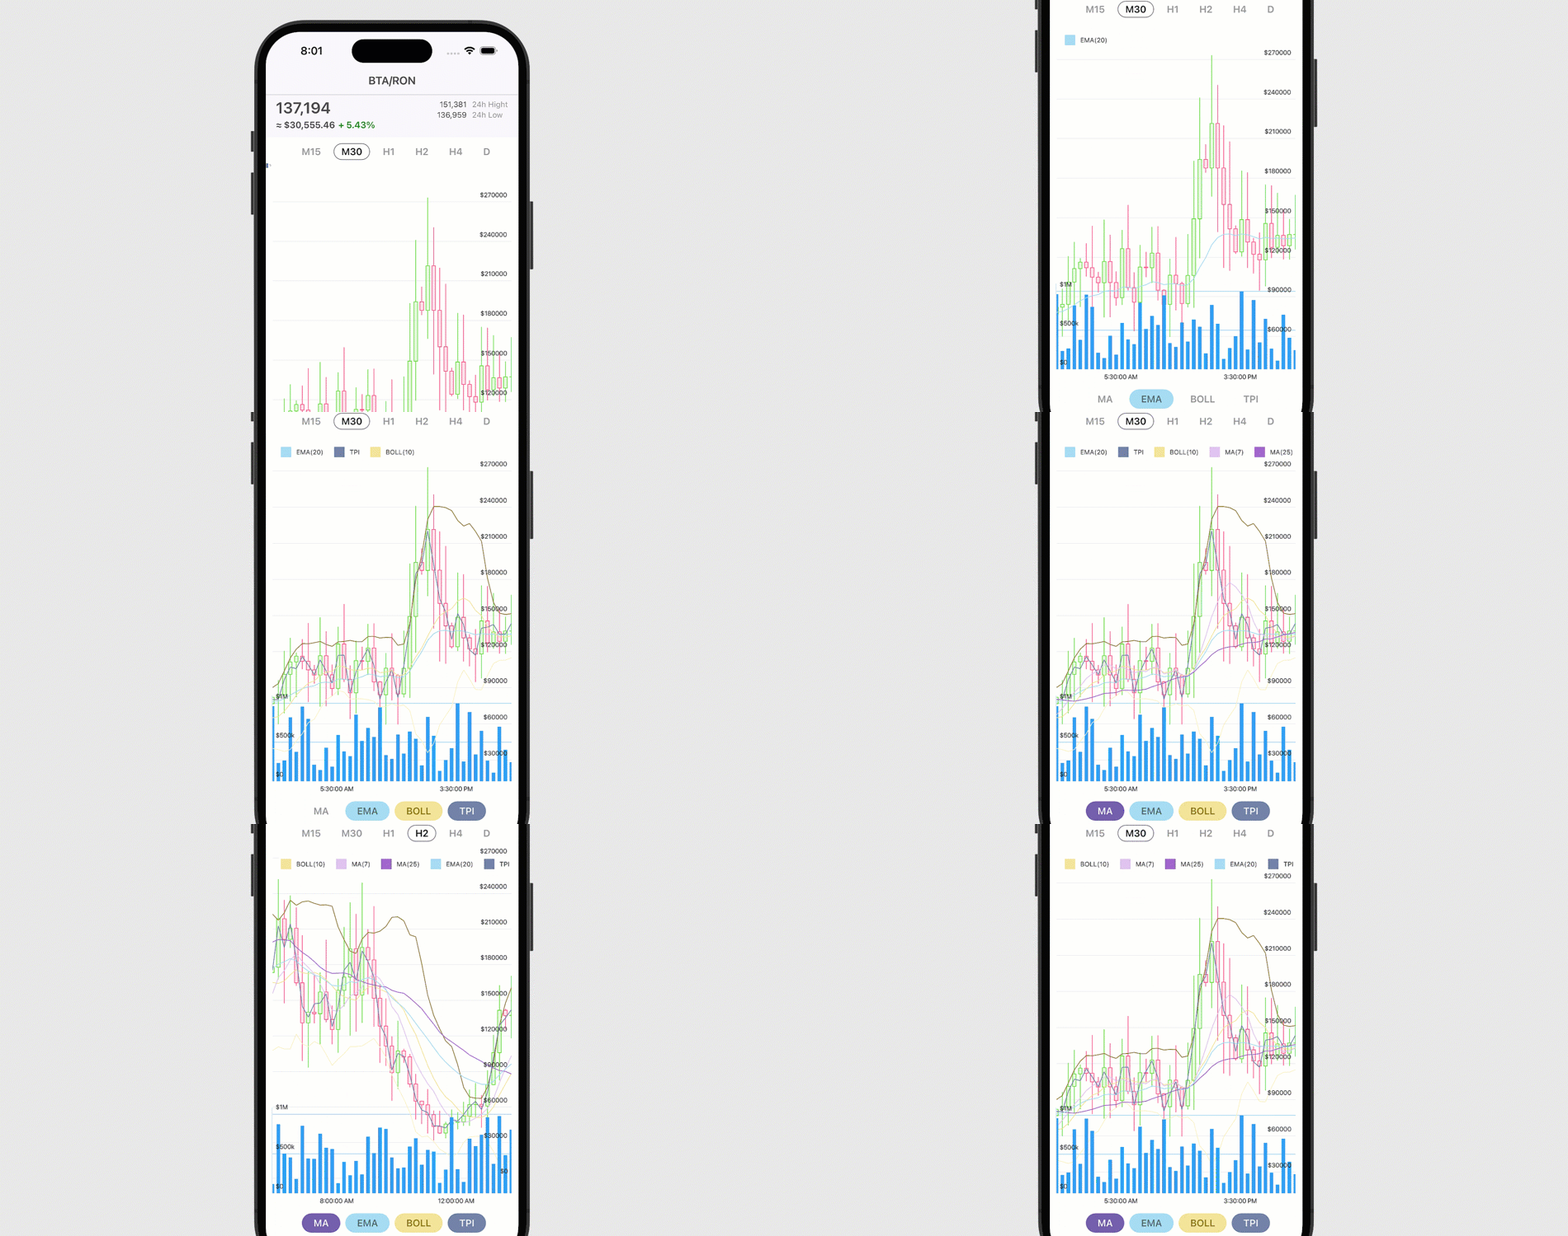
Candlestick Financial Chart with Volume Bars, Indicators and Time Frames

This example demonstrates how to display a financial chart with trading volume bars, financial indicators, and time frame selectors.
Related Controls and Their Properties:
- ChartView: CandleStickSeries, BollingerBandsIndicator, MovingAverageIndicator, ExponentialMovingAverageIndicator, TypicalPriceIndicator, BarSeries
- FilterChipGroup: ChipTextColor, ChipCornerRadius, ChipBorderThickness, ChipSelectedTextColor, ChipBorderColor
- Chip: SelectedBackgroundColor, SelectedTextColor, IsSelected
Implementation Details
Refer to the following GitHub example to see implementation details: