Providing Data
- 4 minutes to read
The Dashboard Designer allows you to bind various dashboard items to data in a virtually uniform manner. To learn more, see the Binding Dashboard Items to Data topic.
The only difference is in the data sections that the required dashboard item has. This topic describes how to bind a Pie dashboard item to data in the Designer or in code.
Binding to Data in the Designer
The image below shows a sample Pie dashboard item that is bound to data.
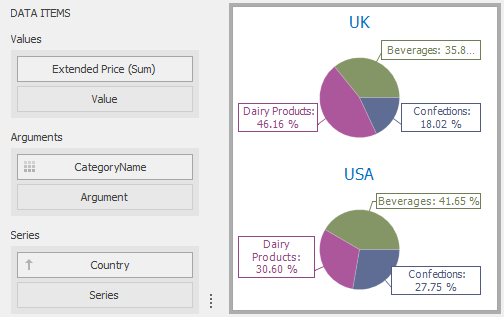
To bind the Pie dashboard item to data, drag and drop a data source field to a placeholder contained in one of the available data sections. A table below lists and describes Pie’s data sections.
Section | Processed as | Description |
|---|---|---|
Values |
Note In case of negative measure values, Pie uses their absolute values. | Contains data items that define the share of pie segments. |
Arguments | Contains data items that provide values used to label pie segments. | |
Series | Contains data items whose values are used to label pie charts. |
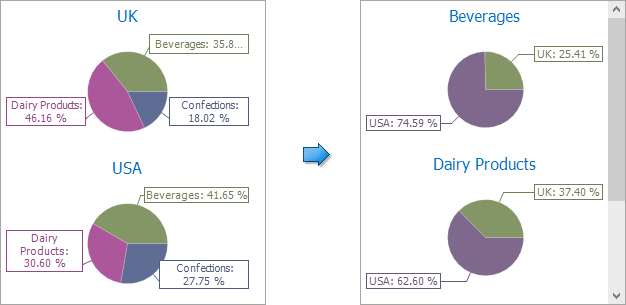
Transposing Arguments and Series
The Pie dashboard item provides the capability to transpose pie arguments and series. In this case, data items contained in the Arguments section are moved to the Series section, and vice versa.
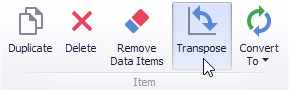
To transpose the selected Pie dashboard item, use the Transpose button in the Home ribbon tab.
Binding to Data in Code
To provide data for the Pie dashboard item, use the following properties.
Arguments | |
Series | |
Values |
Example
The following example demonstrates how to bind a Pie dashboard item to data in code.
Note
A complete sample project is available at https://github.com/DevExpress-Examples/how-to-bind-a-pie-dashboard-item-to-data-in-code-e4769.
Imports System
Imports System.Windows.Forms
Imports DevExpress.DashboardCommon
Imports DevExpress.DataAccess

Namespace Dashboard_CreatePies
    Partial Public Class Form1
        Inherits Form

        Public Sub New()
            InitializeComponent()
        End Sub
        Private Function CreatePies(ByVal dataSource As DashboardObjectDataSource) As PieDashboardItem

            ' Creates a pie dashboard item and specifies its data source.
            Dim pies As New PieDashboardItem()
            pies.DataSource = dataSource

            ' Specifies a measure that provides data used to calculate pie values.
            pies.Values.Add(New Measure("Extended Price"))
            ' Specifies a dimension that provides data for arguments in a pie.
            pies.Arguments.Add(New Dimension("Country"))
            ' Specifies a dimension that provides data for pie series.
            pies.SeriesDimensions.Add(New Dimension("OrderDate"))

            Return pies
        End Function
        Private Sub Form1_Load(ByVal sender As Object, ByVal e As EventArgs) Handles MyBase.Load

            ' Creates a dashboard and sets it as the currently opened dashboard in the dashboard viewer.
            dashboardViewer1.Dashboard = New Dashboard()

            ' Creates a data source and adds it to the dashboard data source collection.
            Dim dataSource As New DashboardObjectDataSource()
            dataSource.DataSource = (New nwindDataSetTableAdapters.SalesPersonTableAdapter()).GetData()
            dashboardViewer1.Dashboard.DataSources.Add(dataSource)

            ' Creates a pie dashboard item with the specified data source
            ' and adds it to the Items collection to display within the dashboard.
            Dim pies As PieDashboardItem = CreatePies(dataSource)
            dashboardViewer1.Dashboard.Items.Add(pies)

            ' Reloads data in the data sources.
            dashboardViewer1.ReloadData()
        End Sub
    End Class
End Namespace