Dashboard Item Group
- 5 minutes to read
The DevExpress Dashboard allows you to group dashboard items. A DashboardItemGroup instance is a container for a group’s items.
The dashboard item group has the following functions:
- Combines dashboard items within the dashboard into a separate layout group.
- Manages the interaction between dashboard items within and outside the group.
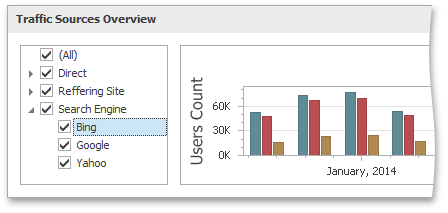
For instance, you can group related filter elements and data visualization dashboard items.
Tip
Watch the video: DevExpress Dashboard: Filters and Groups (YouTube)
Create a Group
To create a new group, use the Group button in the Home ribbon tab.
You can drag-and-drop dashboard items to add them to a group and change their layout. Refer to the Dashboard Item Caption topic for information on how to manage a group’s caption.
Note
You cannot add a dashboard item group to another group.
The DashboardItemGroup class represents a group. A newly created dashboard item group should belong to the dashboard. To add a group to the dashboard, call the Dashboard.CreateGroup method.
To add or remove dashboard items to/from the group, use the DashboardItemGroup.Add/DashboardItemGroup.Remove methods. The DashboardItemGroup.Items property provides access to dashboard items in the current group.
Interactivity
The dashboard item group allows you to manage the interaction between dashboard items in and outside the group.
The image below shows a group’s default interactivity settings:
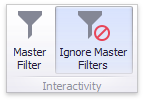
The Master Filter and Ignore Master Filters buttons are located in the Interactivity group on the Data ribbon tab of the Group Tools contextual tab set.
If the Master Filter button is Off, master filter items in a group can filter only this group’s dashboard items.
The enabled Ignore Master Filters option isolates the group from external master filters.
Note
The default group’s interactivity settings are the opposite of the default tab page‘s interactivity settings.
To access the dashboard item group’s interactivity settings in code, use the DashboardItemGroup.InteractivityOptions property. The DashboardItemGroupInteractivityOptions object this property returns, exposes the following members.
- The DashboardItemGroupInteractivityOptions.IsMasterFilter property allows you to filter external dashboard items with the group’s master filter items.
- The FilterableDashboardItemInteractivityOptions.IgnoreMasterFilters property allows you to isolate dashboard items in the group from being filtered with external master filter items.
Example
The following example demonstrates how to combine filter elements to a group and bind them to data in code.
In this example, the dashboard contains the ComboBoxDashboardItem, ListBoxDashboardItem and TreeViewDashboardItem combined into a group. These filter elements allow you to apply filtering to a Chart dashboard item by selecting the required values.
Note
A complete sample project is available at https://github.com/DevExpress-Examples/how-to-combine-filter-elements-to-a-group-and-bind-them-to-data-t191632.
Imports System
Imports DevExpress.DashboardCommon
Imports DevExpress.DataAccess.ConnectionParameters
Imports DevExpress.DataAccess.Sql
Imports DevExpress.XtraEditors

Namespace Dashboard_FilterElements_and_Groups
    Partial Public Class Form1
        Inherits XtraForm

        Public Sub New()
            InitializeComponent()
            Dim dashboard1 As New Dashboard()

            Dim dataSource As New DashboardSqlDataSource()
            dataSource.ConnectionParameters =
                New XmlFileConnectionParameters("..\..\Data\WebsiteStatisticsData.xml")
            Dim selectQuery As SelectQuery = SelectQueryFluentBuilder.AddTable("Data") _
                                             .SelectColumns("Browser", "BrowserDetails", "Date", "Count") _
                                             .Build("Statistics")
            dataSource.Queries.Add(selectQuery)
            dashboard1.DataSources.Add(dataSource)

            Dim comboBox1 As New ComboBoxDashboardItem()
            comboBox1.Name = "Browser"
            comboBox1.DataSource = dataSource
            comboBox1.DataMember = "Statistics"
            comboBox1.FilterDimensions.Add(New Dimension("Browser"))
            comboBox1.ComboBoxType = ComboBoxDashboardItemType.Checked

            Dim listBox1 As New ListBoxDashboardItem()
            listBox1.Name = "Browser Version"
            listBox1.DataSource = dataSource
            listBox1.DataMember = "Statistics"
            listBox1.FilterDimensions.Add(New Dimension("BrowserDetails"))
            listBox1.InteractivityOptions.IgnoreMasterFilters = False

            Dim treeView1 As New TreeViewDashboardItem()
            treeView1.Name = "Date"
            treeView1.DataSource = dataSource
            treeView1.DataMember = "Statistics"
            treeView1.FilterDimensions.AddRange(New Dimension("Date", DateTimeGroupInterval.Year), _
                                                New Dimension("Date", DateTimeGroupInterval.Quarter))
            treeView1.AutoExpandNodes = True

            Dim group1 As New DashboardItemGroup()
            group1.Name = "Filters"
            group1.InteractivityOptions.IsMasterFilter = True
            dashboard1.Groups.Add(group1)
            group1.AddRange(comboBox1, treeView1, listBox1)

            Dim chart1 As New ChartDashboardItem()
            chart1.Name = "Browser Statistics"
            chart1.DataSource = dataSource
            chart1.DataMember = "Statistics"
            chart1.Arguments.Add(New Dimension("Date", DateTimeGroupInterval.MonthYear))
            chart1.SeriesDimensions.AddRange(New Dimension("Browser"), New Dimension("BrowserDetails"))
            chart1.Panes.Add(New ChartPane())
            Dim salesAmountSeries As New SimpleSeries(SimpleSeriesType.SplineArea)
            salesAmountSeries.Value = New Measure("Count")
            chart1.Panes(0).Series.Add(salesAmountSeries)
            dashboard1.Items.Add(chart1)

            dashboardViewer1.Dashboard = dashboard1
        End Sub

        Private Sub Form1_Load(ByVal sender As Object, ByVal e As EventArgs) Handles MyBase.Load
            Dim layoutGroup1 As DashboardLayoutGroup =
                dashboardViewer1.Dashboard.LayoutRoot.FindRecursive(dashboardViewer1.Dashboard.Groups(0))
            layoutGroup1.Orientation = DashboardLayoutGroupOrientation.Vertical
            layoutGroup1.Weight = dashboardViewer1.Dashboard.LayoutRoot.Weight / 5
            dashboardViewer1.SetMasterFilter("comboBoxDashboardItem1", "Internet Explorer")
        End Sub
    End Class
End Namespace