Coloring
Certain dashboard items provide the capability to color dashboard item elements by associating dimension values/measures and specified colors. You can choose whether to use a global color scheme to provide consistent colors for identical values or specify a local color scheme for each dashboard item. To learn more about coloring concepts common for all dashboard items, see the Coloring section.
By default, the Pie dashboard item colors its segments in the following way.
- If the Pie dashboard item contains measures (the Values section) and series dimensions (the Series section), only values corresponding to different measures are colored by hue.
- If the Pie dashboard item contains arguments (the Arguments section), different argument values are colored by hue.
If necessary, you can change the default behavior. For instance, the image below shows the Pie dashboard item whose measures and argument values are colored by hue.
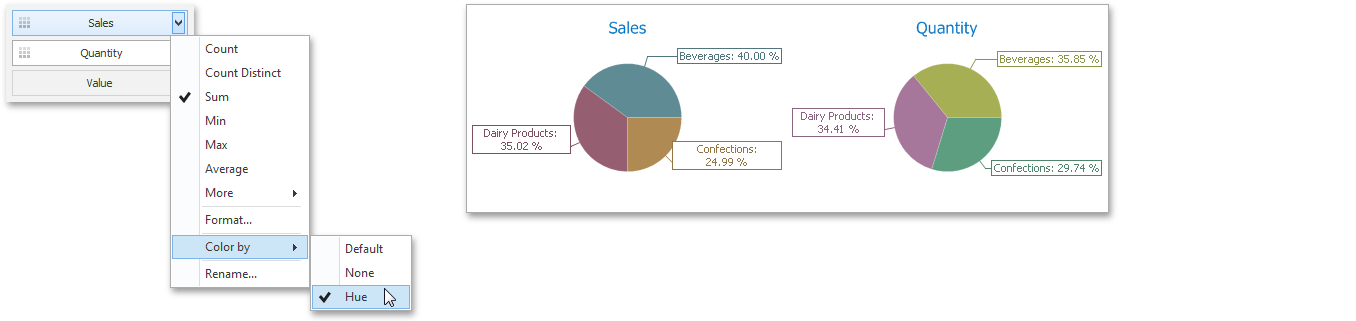
To access Pie coloring options in code, use the ChartDashboardItemBase.ColoringOptions property.