Providing Data
- 5 minutes to read
This topic describes how to bind the Bubble Map dashboard item to data using the Dashboard Designer, or directly in code.
The Dashboard Designer allows you to bind various dashboard items to data in a virtually uniform manner (see Binding Dashboard Items to Data in the Designer for details). The only difference is in the data sections that these dashboard items have.
Binding to Data in the Designer
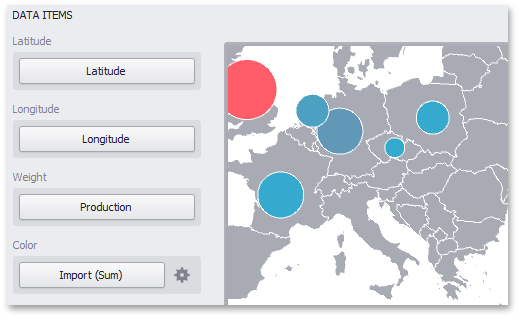
The image below shows a sample Bubble Map dashboard item that is bound to data.
Note that the Bubble Map provides two data item groups for data binding: DATA ITEMS and TOOLTIP DATA ITEMS. Tables below list the available data sections.
Data Items
Section | Processed as | Description | API |
|---|---|---|---|
Latitude | Accepts a dimension used to provide geographic latitude. | ||
Longitude | Accepts a dimension used to provide geographic longitude. | ||
Weight | Accepts a measure used to evaluate the bubble’s weight. | ||
Color | Accepts a measure used to evaluate the bubble’s color. The Bubble Map dashboard item automatically selects palette and scale settings used to color bubbles. To customize these settings, click the Options button next to the Color placeholder. This invokes the Color Scale Options dialog, which allows you to specify the palette and scale options. To learn how to use this dialog, see Coloring. |
Tooltip Data Items
| Section | Processed as | Description | API |
|---|---|---|---|
| Dimensions | Dimension | Accepts dimensions allowing you to add supplementary content to the tooltips. | GeoPointMapDashboardItemBase.TooltipDimensions |
| Measures | Measure | Accepts measures allowing you to add summaries to the tooltips. | MapDashboardItem.TooltipMeasures |
Example
The following example demonstrates how to bind a Bubble Map dashboard item to data in code and customize its palette.
Note
A complete sample project is available at https://github.com/DevExpress-Examples/how-to-bind-a-bubble-map-dashboard-item-to-data-and-customize-its-palette-t119682.
using System;
using System.Collections.Generic;
using DevExpress.DashboardCommon;
using DevExpress.DataAccess.ConnectionParameters;
using DevExpress.DataAccess.Sql;
using DevExpress.XtraEditors;

namespace Dashboard_CreateBubbleMap {
    public partial class Form1 : XtraForm {
        public Form1() {
            InitializeComponent();
        }

        private void Form1_Load(object sender, EventArgs e) {
            // Creates a new dashboard and a data source for this dashboard.
            Dashboard dashboard = new Dashboard();
            DashboardSqlDataSource dataSource = new DashboardSqlDataSource();
            dataSource.ConnectionParameters =
                new XmlFileConnectionParameters(@"..\..\Data\DashboardEnergyStatictics.xml");
            SelectQuery sqlQuery = SelectQueryFluentBuilder
                .AddTable("Countries")
                .SelectColumns("Latitude", "Longitude", "Production", "Import", "Country")
                .Build("Countries");

            dataSource.Queries.Add(sqlQuery);
            dashboard.DataSources.Add(dataSource);

            // Creates a Bubble Map dashboard item and specifies its data source.
            BubbleMapDashboardItem bubbleMap = new BubbleMapDashboardItem();
            bubbleMap.DataSource = dashboard.DataSources[0];
            bubbleMap.DataMember = "Countries";

            // Loads the map of the world.
            bubbleMap.Area = ShapefileArea.Europe;

            // Provides cities' coordinates.
            bubbleMap.Latitude = new Dimension("Latitude");
            bubbleMap.Longitude = new Dimension("Longitude");

            // Specifies measures used to evaluate bubble weights and colors.
            bubbleMap.Weight = new Measure("Production", SummaryType.Sum);
            bubbleMap.Color = new Measure("Import", SummaryType.Sum);
            bubbleMap.Color.NumericFormat.FormatType = DataItemNumericFormatType.General;

            // Provides additional values displayed within bubble tooltips.
            bubbleMap.TooltipDimensions.Add(new Dimension("Country"));

            // Specifies a custom scale and shows map legends.
            CustomizeScale(bubbleMap);
            ShowLegends(bubbleMap);

            // Adds the Bubble Map dashboard item to the dashboard and opens this
            // dashboard in the Dashboard Viewer.
            dashboard.Items.Add(bubbleMap);
            dashboardViewer1.Dashboard = dashboard;
        }

        private void CustomizeScale(BubbleMapDashboardItem map) {
            CustomScale customScale = new CustomScale();
            List<double> rangeStops = new List<double>();

            // Specifies that the absolute scale is used to define a set of range stops.
            customScale.IsPercent = false;

            // Specifies custom range stops.
            rangeStops.Add(20);
            rangeStops.Add(200);
            rangeStops.Add(500);
            rangeStops.Add(2000);

            // Adds custom range stops to a custom scale.
            customScale.RangeStops.AddRange(rangeStops);

            map.ColorScale = customScale;
        }

        private void ShowLegends(BubbleMapDashboardItem map) {
            // Enables map legends and specifies its position and orientation.
            map.Legend.Visible = true;
            map.Legend.Orientation = MapLegendOrientation.Horizontal;
            map.WeightedLegend.Visible = true;
            map.WeightedLegend.Position = MapLegendPosition.BottomLeft;
        }
    }
}