Measures and Dimensions
- 2 minutes to read
The main DevExpress Dashboard capabilities are aggregating and summarizing data obtained form the underlying data source. Dimensions and measures are key concepts used to perform these operations.
- Dimension
The dimension is used to provide discrete categorical information. These values can be of any type - string, date-time or numeric. In any case, the dashboard does not summarize the dimension values, but groups identical values. You can perform grouping, sorting, or display the top values for the dimension values.
In code, dimensions are represented by the Dimension class.
- Measure
The measure is used to summarize data against grouped dimension values. These values can be of any type - numeric, date-time or string. In any case, the dashboard will calculate an appropriate summary function against measure values. You can also customize the data format settings that affect how summary values are displayed.
In code, measures are represented by the Measure class.
Data Item
A common term combining measures and dimensions is a data item that is an object used to bind a dashboard item to data source fields.
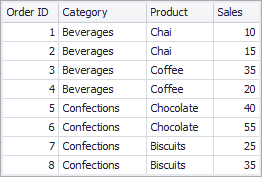
The sample underlying data source in the image below contains four fields: Order ID, Category, Product and Sales.
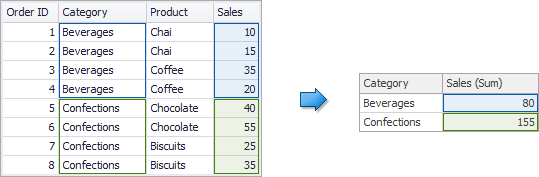
If you process the Category field as a dimension and the Sales field as a measure, the Dashboard will group identical category values (‘Beverages’ and ‘Confections’ in this case) and will summarize sales values against these categories.
Hidden Data Items
If you need data items that do not directly take part in the visual representation of data, you can use hidden data items. To get more information, see the following articles: