TrendLine.ExtrapolateToInfinity Property
Specifies whether the Trend Line is extrapolated to infinity.
Namespace: DevExpress.XtraCharts
Assembly: DevExpress.XtraCharts.v19.1.dll
Declaration
[XtraChartsLocalizableCategory(XtraChartsCategory.Behavior)]
[XtraSerializableProperty]
public bool ExtrapolateToInfinity { get; set; }Property Value
| Type | Description |
|---|---|
| Boolean | true if the Trend Line is extrapolated to infinity; otherwise, false. |
Remarks
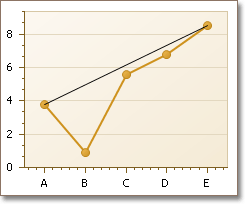
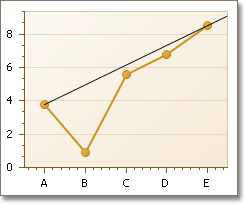
The following images demonstrate the use of the ExtrapolateToInfinity property.
| ExtrapolateToInfinity = false | ExtrapolateToInfinity = true |
|---|---|
 |
 |
For more information, refer to Trend Lines.
Example
This example demonstrates how a Trend Line can be added to a series’ collection of indicators at runtime.
Note
A complete sample project is available at https://github.com/DevExpress-Examples/how-to-add-a-trend-line-to-a-chart-e1245
using System;
using System.Drawing;
using System.Windows.Forms;
using DevExpress.XtraCharts;
// ...
        private void Form1_Load (object sender, EventArgs e) {
            // Create an empty chart.
            ChartControl stockChart = new ChartControl();

            // Create a stock series, add it to the chart and set its properties.
            Series series1 = new Series("Series 1", ViewType.Stock);
            stockChart.Series.Add(series1);
            series1.ArgumentScaleType = ScaleType.DateTime;
            series1.ValueScaleType = ScaleType.Numerical;

            // Add points to the series.
            series1.Points.Add(new SeriesPoint(new DateTime(1994, 3, 1),
                new object[] { 4.00, 5.00, 5.00, 4.85 }));
            series1.Points.Add(new SeriesPoint(new DateTime(1994, 3, 2),
                new object[] { 6.05, 8.05, 6.05, 7.05 }));
            series1.Points.Add(new SeriesPoint(new DateTime(1994, 3, 3),
                new object[] { 6.25, 8.25, 6.75, 7.15 }));

            // Create and customize a trendline,
            TrendLine trendline1 = new TrendLine("A Trend");
            trendline1.Point1.Argument = new DateTime(1994, 3, 1);
            trendline1.Point1.ValueLevel = ValueLevel.High;
            trendline1.Point2.Argument = new DateTime(1994, 3, 3);
            trendline1.Point2.ValueLevel = ValueLevel.High;
            trendline1.ExtrapolateToInfinity = false;
            trendline1.Color = Color.Red;
            trendline1.LineStyle.DashStyle = DashStyle.Dash;


            // Cast the view type of the series to the Stock view.
            StockSeriesView myView = ((StockSeriesView)series1.View);

            // Define the Y-axis range.
            myView.AxisY.WholeRange.AlwaysShowZeroLevel = false;

            // Add the trendline to the series collection of indicators.
            myView.Indicators.Add(trendline1);

            // Add the chart to the form.
            stockChart.Dock = DockStyle.Fill;
            this.Controls.Add(stockChart);
        }
See Also