AxisRange.SideMarginsEnabled Property
OBSOLETE
This property is obsolete now. Use AxisBase.VisualRange.AutoSideMargins instead. To calculate side margins automatically, enable the VisualRange.AutoSideMargins property. When the VisualRange.AutoSideMargins property is disabled it becomes possible to specify custom side margins values using the VisualRange.SideMarginsValue property.
Specifies whether a space should be left between the outermost series point and the diagram’s edge.
Namespace: DevExpress.XtraCharts
Assembly: DevExpress.XtraCharts.v19.1.dll
Declaration
[Obsolete("This property is obsolete now. Use AxisBase.VisualRange.AutoSideMargins instead. To calculate side margins automatically, enable the VisualRange.AutoSideMargins property. When the VisualRange.AutoSideMargins property is disabled it becomes possible to specify custom side margins values using the VisualRange.SideMarginsValue property.")]
[Browsable(false)]
[XtraSerializableProperty]
public bool SideMarginsEnabled { get; set; }Property Value
| Type | Description |
|---|---|
| Boolean | true if the axis range is automatically widened; otherwise, false. |
Remarks
Use the SideMarginsEnabled property so that an axis will automatically extend its range, ensuring that indents are preserved on the both ends of the axis.
Note
When using the Numerical scale type, it is possible to change side margins only for automatically calculated axis ranges. So, make sure the AxisRange.Auto property of the AxisRange object is set to True.
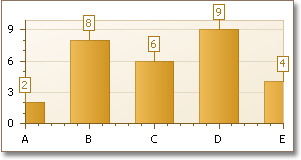
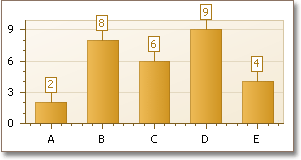
The following images demonstrate the SideMarginsEnabled property in action.
| SideMarginsEnabled = false (for the X-axis) | SideMarginsEnabled = true (for the X-axis) |
|---|---|
 |
 |
For more information, refer to Visual Ranges and Whole Ranges .
Example
This example demonstrates how to use the AxisBase.VisualRange property to define the visible range of an axis, and the AxisBase.WholeRange property to define its whole range.
For more information on axis range, refer to Visual Ranges and Whole Ranges .
Note
A complete sample project is available at https://github.com/DevExpress-Examples/how-to-customize-an-axis-range-t217661
using DevExpress.XtraCharts;
using System;
using System.Windows.Forms;

namespace WindowsFormsApplication1 {
    public partial class Form1 : Form {
        public Form1() {
            InitializeComponent();
        }

        private void Form1_Load(object sender, EventArgs e) {

            // Create a chart control.
            ChartControl chartControl1 = new ChartControl();

            // Add the chart to the form.
            chartControl1.Dock = DockStyle.Fill;
            this.Controls.Add(chartControl1);

            // Create a bar series and add points to it.
            Series series1 = new Series("Series 1", ViewType.Bar);
            series1.Points.Add(new SeriesPoint("A", new double[] { 26.25 }));
            series1.Points.Add(new SeriesPoint("B", new double[] { 1.52 }));
            series1.Points.Add(new SeriesPoint("C", new double[] { 22.21 }));
            series1.Points.Add(new SeriesPoint("D", new double[] { 15.35 }));
            series1.Points.Add(new SeriesPoint("E", new double[] { 4.15 }));

            // Add the series to the chart.
            chartControl1.Series.Add(series1);

            // Cast the chart's diagram to the XYDiagram type, to access its axes.
            XYDiagram diagram = (XYDiagram)chartControl1.Diagram;

            // Enable the diagram's scrolling.
            diagram.EnableAxisXScrolling = true;
            diagram.EnableAxisYScrolling = true;

            // Define the whole range for the X-axis.
            diagram.AxisX.WholeRange.Auto = false;
            diagram.AxisX.WholeRange.SetMinMaxValues("A", "D");

            // Disable the side margins
            // (this has an effect only for certain view types).
            diagram.AxisX.VisualRange.AutoSideMargins = false;

            // Limit the visible range for the X-axis.
            diagram.AxisX.VisualRange.Auto = false;
            diagram.AxisX.VisualRange.SetMinMaxValues("B", "C");

            // Define the whole range for the Y-axis.
            diagram.AxisY.WholeRange.Auto = false;
            diagram.AxisY.WholeRange.SetMinMaxValues(1, 26);
        }
    }
}