Duplicate Code
- 2 minutes to read
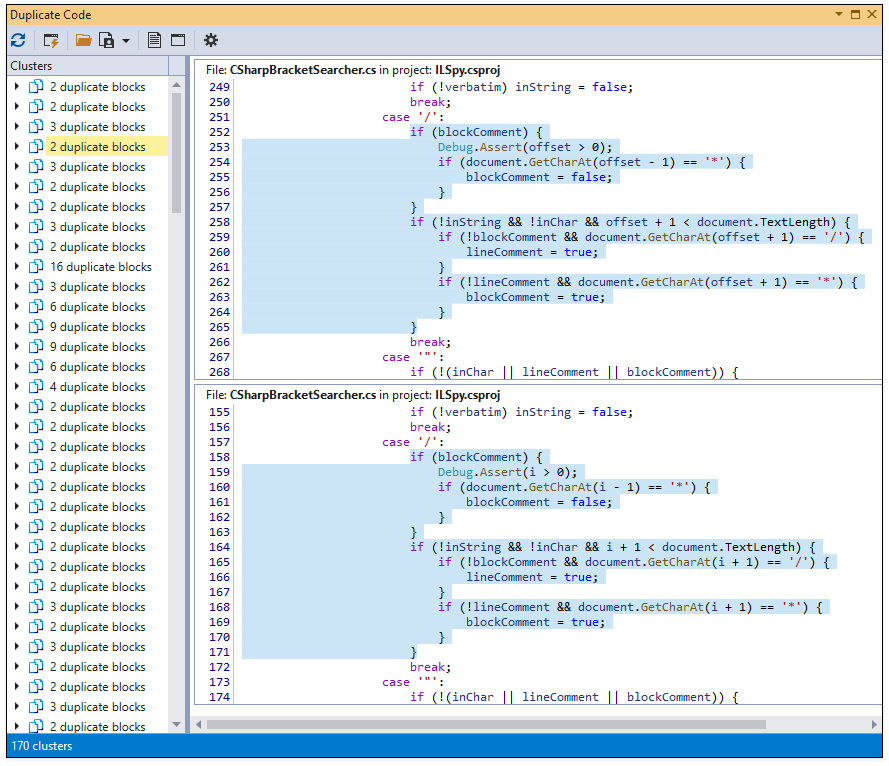
The Duplicate Code tool window detects structurally similar blocks of C# code (clusters) in a solution or an active project. This tool helps improve code-base quality.
Duplicate Code Analysis
To find duplicate code in a C# solution:
Open the solution.
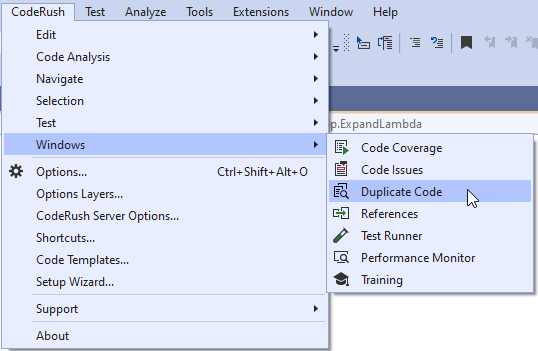
Select CodeRush | Windows | Duplicate Code from the Visual Studio main menu.
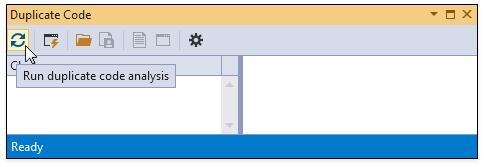
Click Refresh in the invoked Duplicate Code tool window to run duplicate code analysis.
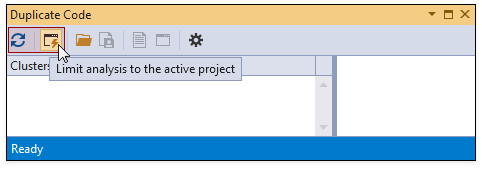
To only analyze duplicate code within the active project, toggle Limit analysis to the active project in the Duplicate Code window and click Refresh.
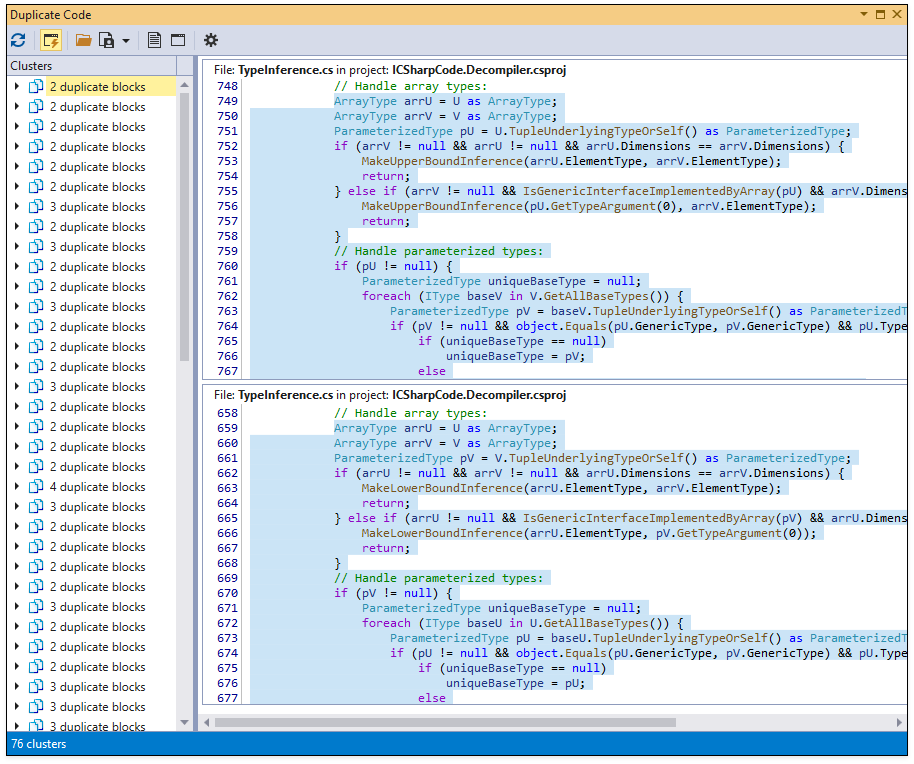
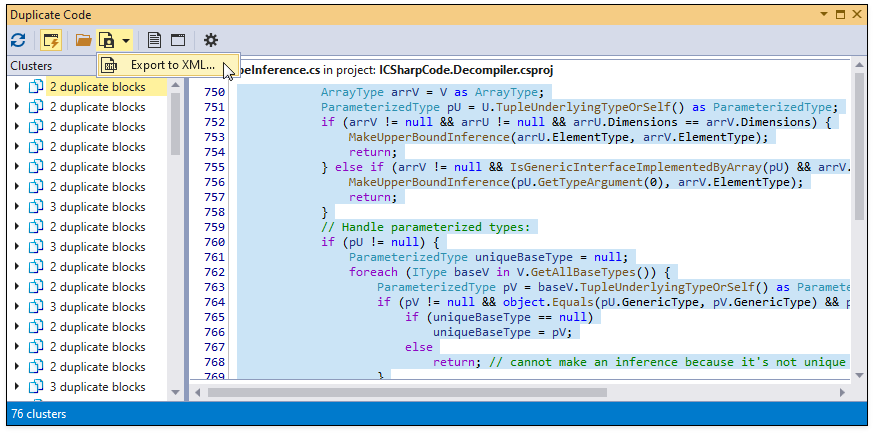
When duplicate code analysis is complete, CodeRush shows code blocks in a cluster list and highlights duplicate code in the code preview.
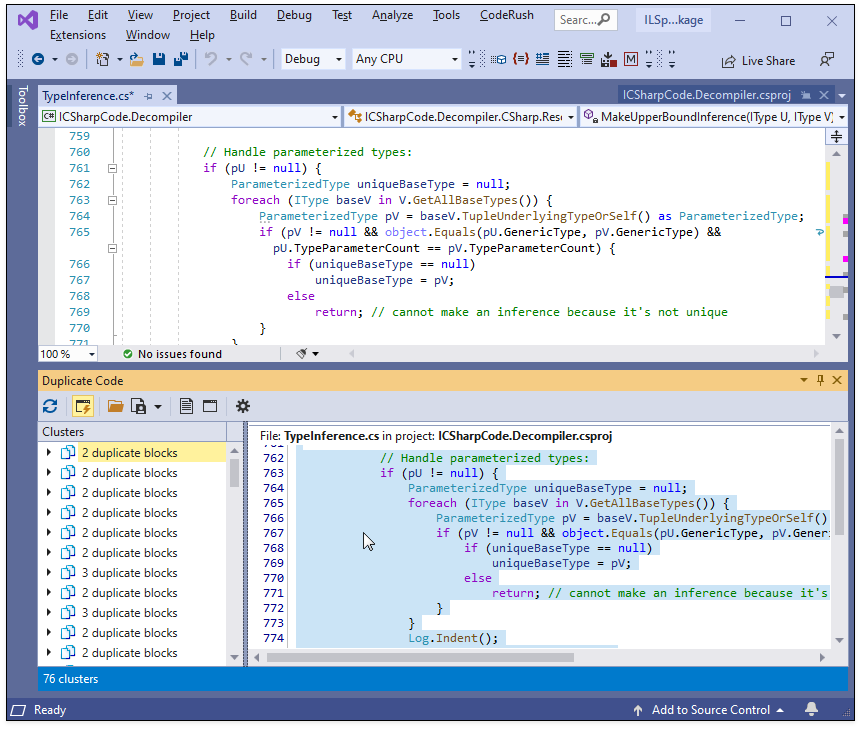
To open duplicate code in the code editor, double-click it in the code preview.
Duplicate Code Navigation
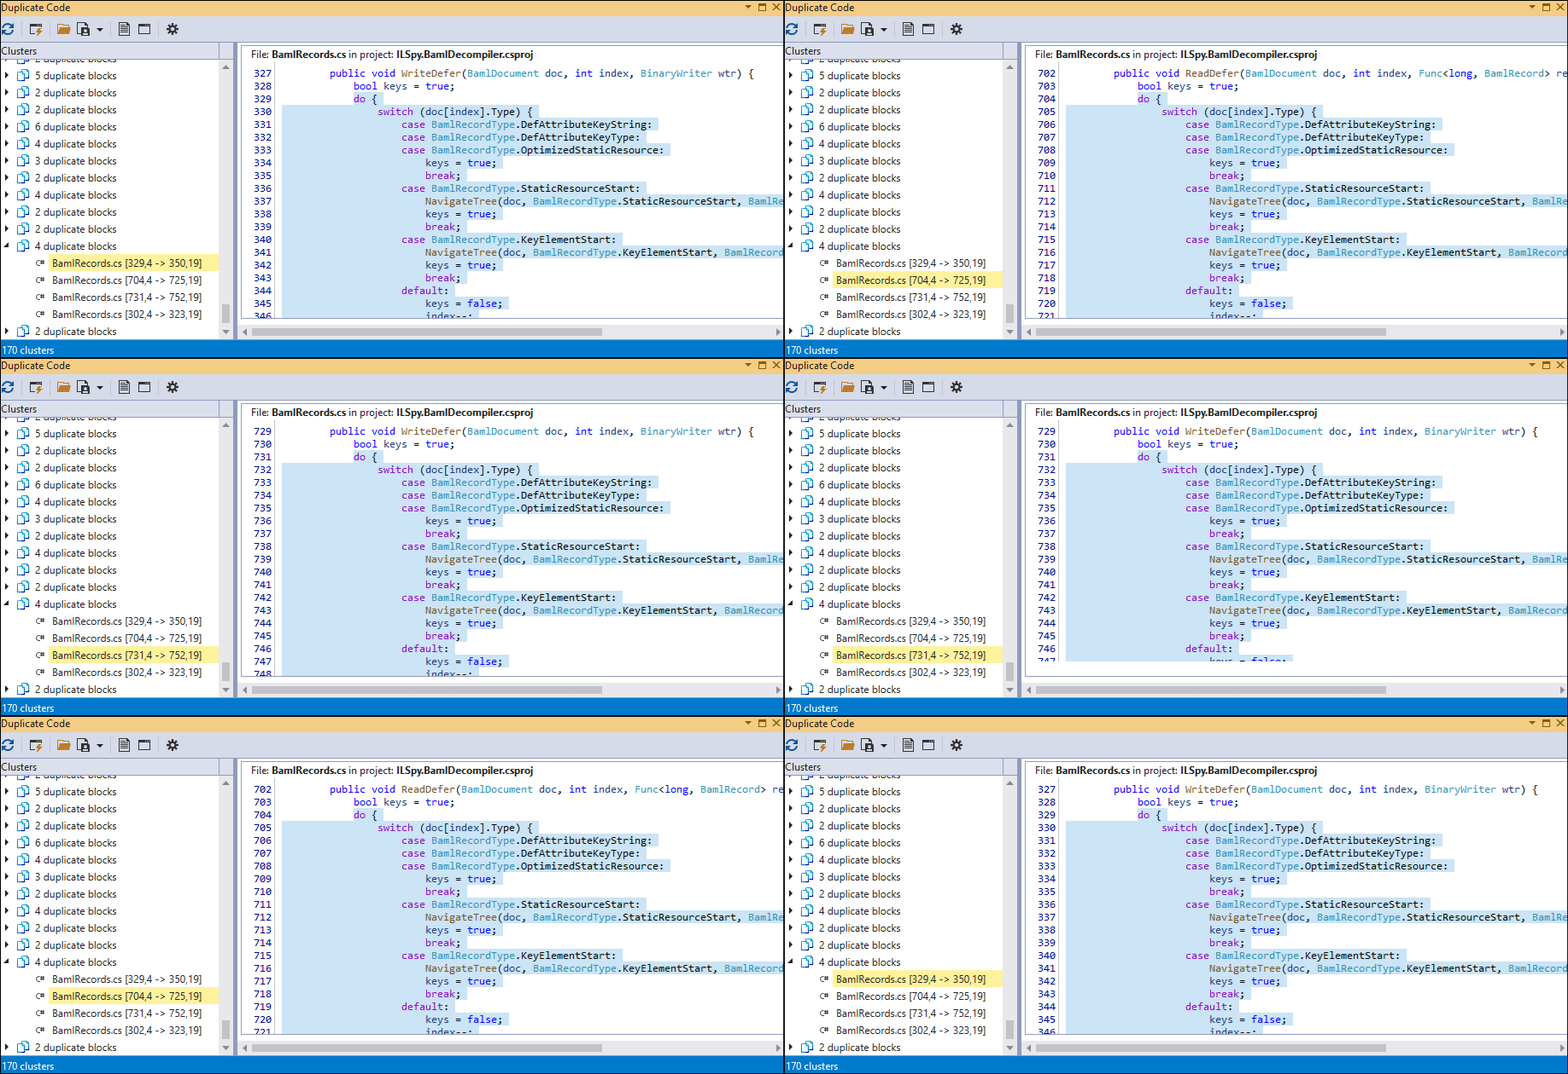
Expand a node in the cluster list and press Down or Up keys to navigate between duplicate code blocks within a cluster.
Duplicate Code Grouping
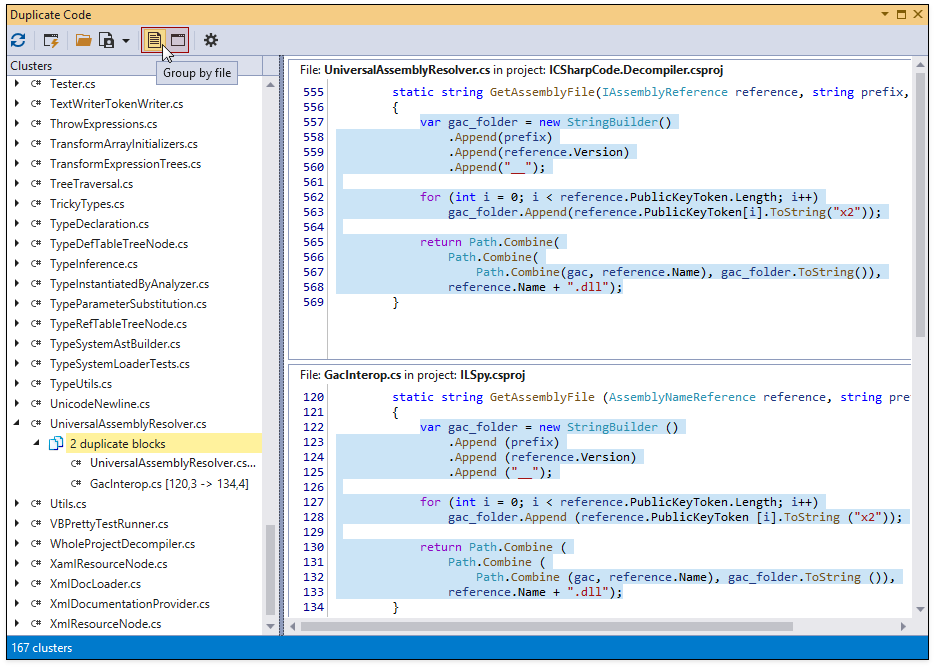
Toggle “Group by file” or “Group by project” to group clusters. The image below shows clusters grouped by files.
Import/Export Duplicate Code Analysis Report
Click “Open duplicate code analysis results” or “Export to XML…” to import/export duplicate code analysis results to XML.
Configure Granularity Level
You can configure the search engine’s granularity level on the Editor | C# | Code Analysis | Duplicate Code options page in the CodeRush Options dialog.
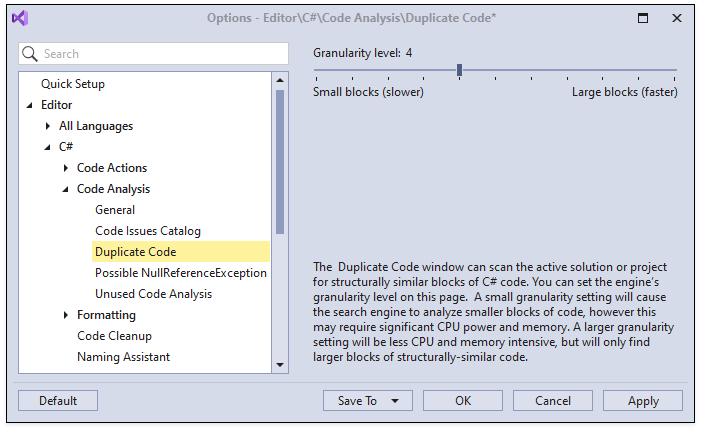
The granularity level setting lets you balance performance and memory use with the quality and size of the result set.
When the granularity level is low, duplicate code analysis can find smaller blocks of duplicated code. This may take a long time and use a significant amount of memory during analysis.
When the granularity level is high, duplicate code analysis finds larger blocks of duplicated code. As a result, the search engine uses less memory and collects results quickly.