Code Metrics
- 3 minutes to read
Code Metrics is a set of measurements that allow developers to estimate code complexity.
The following Code Metrics are available:
| Name | Description |
|---|---|
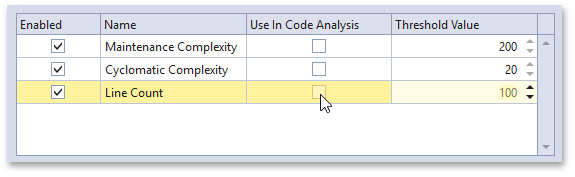
| Maintenance Complexity | This metric is calculated as a total maintenance complexity value for all code elements in the member’s implementation. This value is from 0 to infinity and estimates maintaining the member’s code. Methods whose a maintenance complexity value is less than 100 are easier to maintain. If you have methods with a value of more than 300, consider refactoring them. Different code elements’ maintenance complexity values (local variable declarations, assignment statements, expressions in for loops, unary operator, etc.) are constant. |
| Cyclomatic Complexity | This metric measures the structural complexity of the code. It is calculated according to the number of different code paths in the program flow. A program with a complex control flow requires more tests to cover code and is less maintainable. |
| Line Count | The metric indicates the total number of lines the member occupies. Blank lines are also counted. |
How to Enable
Do one of the following to enable the Code Metrics feature:
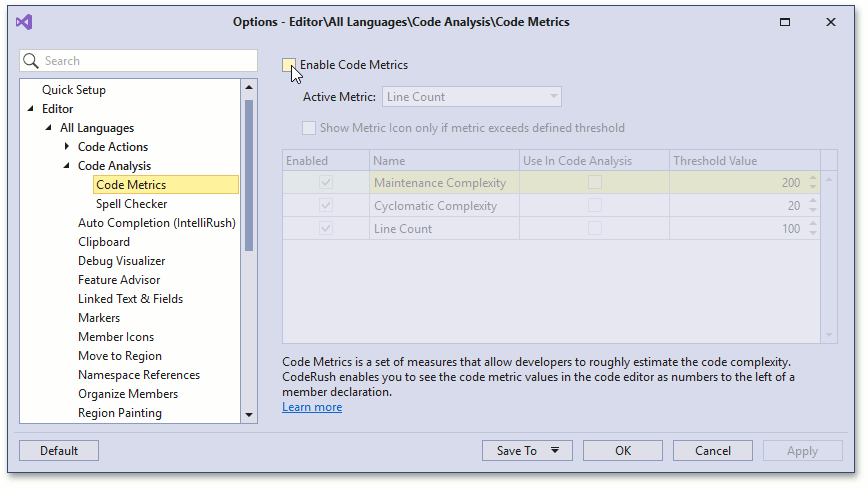
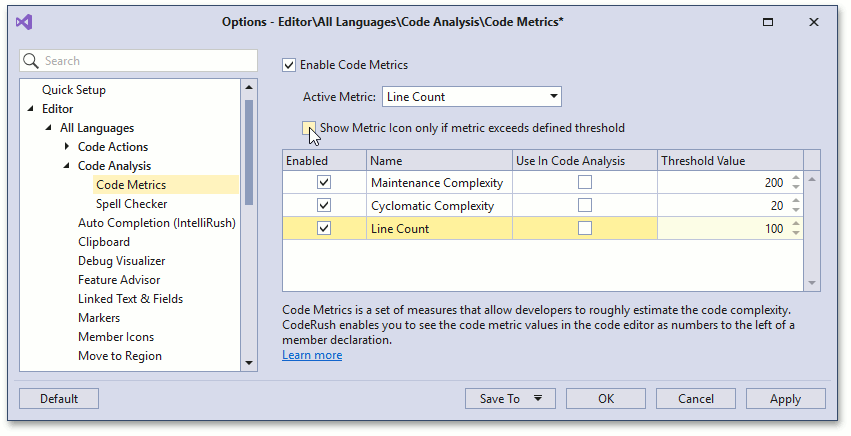
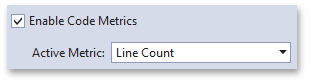
- Check the Enable Code Metrics checkbox in the Editor | All Languages | Code Analysis | Code Metrics options page;
or
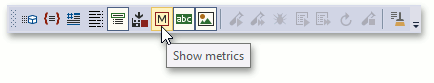
- Click the Show metrics button in the CodeRush Visualize toolbar.
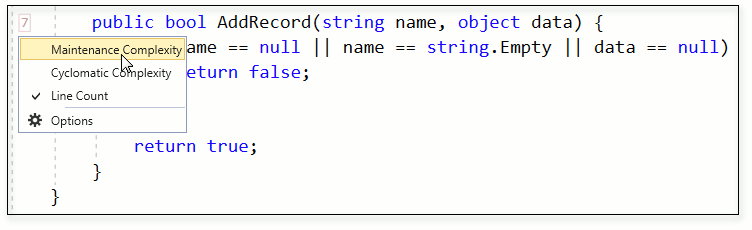
Once this feature is enabled, CodeRush shows metrics to the left of a member declaration in the code editor.

You should click the metric number and use the menu to select a different code metric.
Customization
You can configure each Code Metric’s threshold value in the Editor | All Languages | Code Analysis | Code Metrics options page.
Hide Metrics if the Threshold is not Exceeded
CodeRush can hide the metric values in the code editor if the threshold is not exceeded. To customize this behavior:
- Check the “Show Metric Icon only if metric exceeds defined threshold” checkbox in the Code Metrics options page.
- Click Apply and OK to close the dialog and save the changes.
Treat Exceeding the Metric’s Threshold Value as a Code Issue
Follow the steps below to customize this behavior for a member whose line count exceed the defined threshold value.
For example, the AddRecord method has 7 lines. The threshold value is 5.
Open the Code Metrics options page.
Make sure the Line Count metric is active.
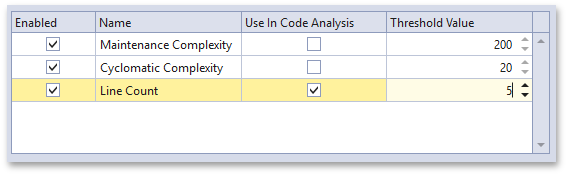
- Enable the “Use In Code Analysis” option for the Line Count metric.
- Set the default threshold value to 5.
- Click Apply and OK to close the dialog and save the changes.
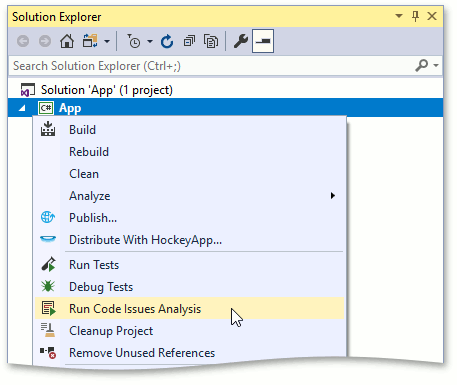
- Run Code Issues Analysis to find members whose metrics exceed the threshold. For this, switch to the Solution Explorer, right-click a project to invoke the context menu, and select the Run Code Issues Analysis menu item.
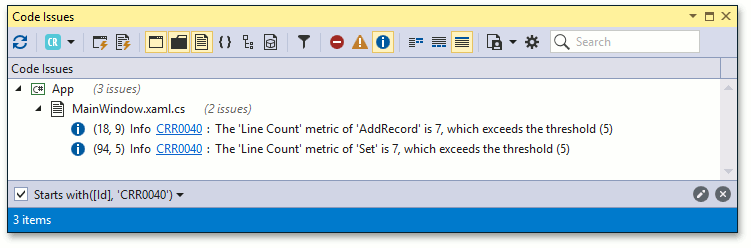
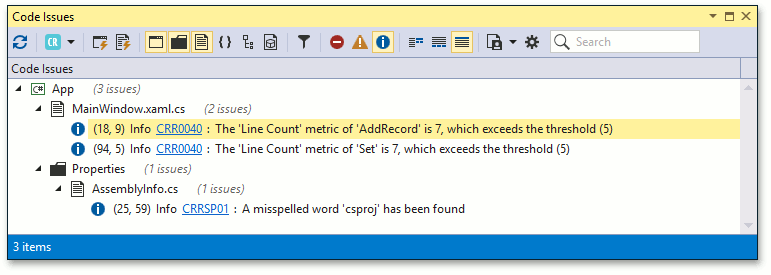
This action opens the Code Issues window.
Filter Code Metrics Diagnostics
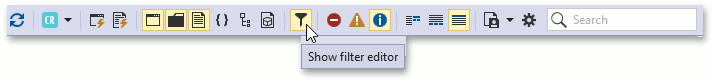
- Click the “Show filter editor” button from the bar at the top of the Code Issues window.
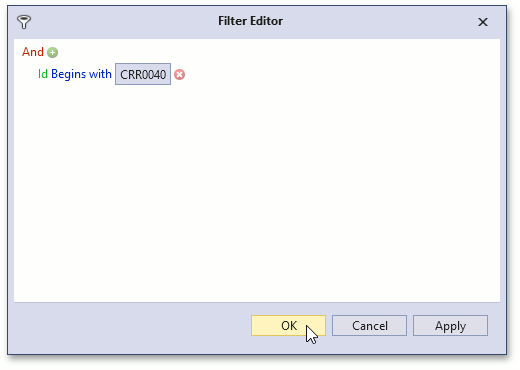
- Specify the “Id Begins with CRR0040” condition in the filter editor and click OK.
As a result, a list of all members in which metric values exceed a defined threshold is displayed.