DxChartAxisBase<T>.LogarithmBase Property
Specifies the value to be raised to a power when the chart generates ticks for an axis of the Logarithmic type.
Namespace: DevExpress.Blazor
Assembly: DevExpress.Blazor.v25.1.dll
NuGet Package: DevExpress.Blazor
Declaration
[Parameter]
public int LogarithmBase { get; set; }
Property Value
| Type | Description |
|---|---|
| Int32 | A logarithm base. |
Remarks
The DxChart<T> component automatically detects the first series’s data type and uses it to render X (argument) and Y (value) axes.
When arguments/values grow rapidly, set the axis’s Type property to ChartAxisType.Logarithmic to visualize a data set exponentially. Each axis argument/value equals to the LogarithmBase value raised to a power. For instance, if LogarithmBase is set to 10, the following arguments/values are displayed: 10⁻², 10⁻¹, 10⁰, 10¹, 10⁻², etc.
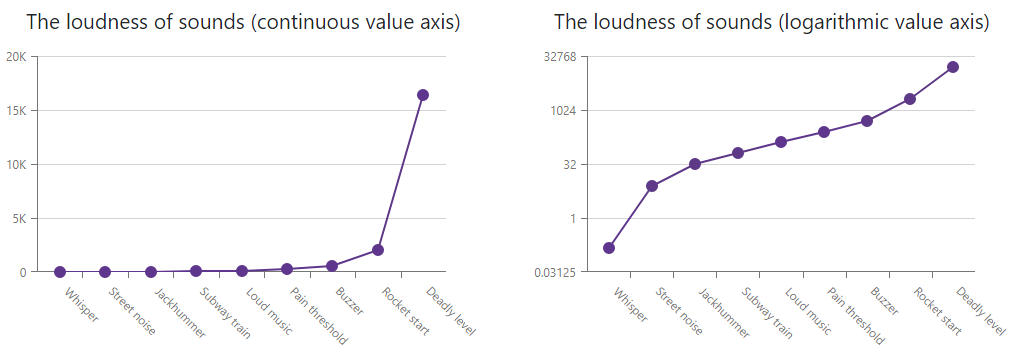
The following example displays argument axes of the Discrete type, and value axes of Continuous and Logarithmic types, respectively. The LogarithmBase property for the second chart is set to 2.
<DxChart Data="@GetData()">
    <DxChartTitle Text="@($"The loudness of sounds (continuous value axis)")" />
    <DxChartLegend Visible="false" />
    <DxChartArgumentAxis Type="ChartAxisType.Discrete" />
    <DxChartValueAxis Type="ChartAxisType.Continuous" />
    <DxChartLineSeries ArgumentField="@((DataPoint s) => s.Argument)" ValueField="@((DataPoint s) => s.Value)" />
</DxChart>
<DxChart Data="@GetData()">
    <DxChartTitle Text="@($"The loudness of sounds (logarithmic value axis)")" />
    <DxChartLegend Visible="false" />
    <DxChartArgumentAxis Type="ChartAxisType.Discrete" />
    <DxChartValueAxis Type="ChartAxisType.Logarithmic" LogarithmBase="2" />
    <DxChartLineSeries ArgumentField="@((DataPoint s) => s.Argument)" ValueField="@((DataPoint s) => s.Value)" />
</DxChart>