Custom summaries allow you to calculate summaries using custom algorithms. You can:
- calculate a custom summary function;
- use multiple data fields in a summary calculation;
- calculate a summary for individual records (for instance, for the records which match specific criteria).
To enable a custom summary calculation, set the data field’s PivotGridFieldBase.SummaryType property to PivotSummaryType.Custom. Then handle the ASPxPivotGrid.CustomSummary event to implement a custom summary calculation algorithm. This event is fired for each summary cell that corresponds to this data field.
When you handle the ASPxPivotGrid.CustomSummary event, use the PivotGridCustomSummaryEventArgsBase<T>.CreateDrillDownDataSource method to obtain a subset of records in a datasource that correspond to the currently processed summary cell.
Example: How to Calculate a Custom Summary
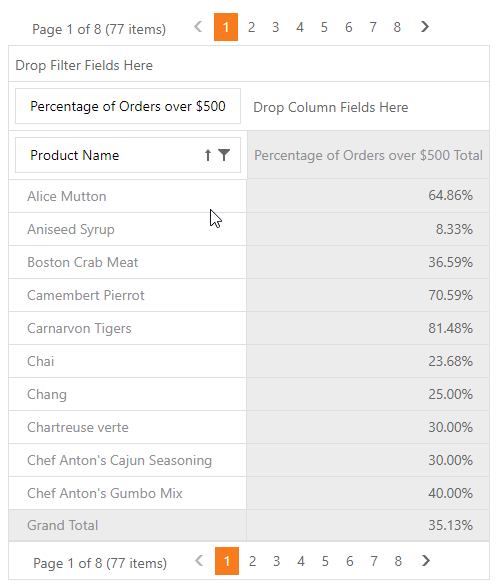
This example demonstrates different approaches to calculate a custom summary.
The task is to calculate the percentage of units that cost over $50 and show that value in the total columns.
The following approaches are shown:
The CustomSummary event. A custom summary is calculated for the “Unit Price” field. The field’s SummaryType property is set to PivotSummaryType.Custom. The ASPxPivotGrid.CustomSummary event is handled to count the records whose total sum exceeds $50. The ratio of these records to all the records is assigned to the e.CustomValue parameter.
An unbound expression. A field is an unbound field with an expression that calculates the ratio.
Data Binding API. In Optimized mode create a field bound to the ExpressionDataBinding object with the following expression:
ToDecimal(Sum(iif([Extended_Price]>=500,1,0)))/Count()
View Example: How to Implement Custom Summary
<dx:ASPxPivotGrid ID="ASPxPivotGrid1" runat="server" DataSourceID="AccessDataSource1" Theme="Office365">
    <OptionsData DataProcessingEngine="Optimized" />
    <Fields>
        <dx:PivotGridField ID="fieldProductName" Area="RowArea" AreaIndex="0"
            Caption="Product Name" FieldName="ProductName">
        </dx:PivotGridField>
        <dx:PivotGridField ID="fieldExtendedPriceNew" Area="DataArea" AreaIndex="0"
            Caption="Percentage of Orders over $500">
            <DataBindingSerializable>
                <dx:ExpressionDataBinding Expression="ToDecimal(Sum(iif([Extended_Price]>=500,1,0)))/Count()" />
            </DataBindingSerializable>
            <CellFormat FormatString="p" FormatType="Numeric"></CellFormat>
        </dx:PivotGridField>
    </Fields>
</dx:ASPxPivotGrid>
<dx:ASPxPivotGrid ID="ASPxPivotGrid1" runat="server" DataSourceID="AccessDataSource1" Theme="Office365">
    <OptionsData DataProcessingEngine="Optimized" />
    <Fields>
        <dx:PivotGridField ID="fieldProductName" Area="RowArea" AreaIndex="0"
            Caption="Product Name" FieldName="ProductName">
        </dx:PivotGridField>
        <dx:PivotGridField ID="fieldExtendedPriceNew" Area="DataArea" AreaIndex="0"
            Caption="Percentage of Orders over $500"
            UnboundExpression="ToDecimal(Sum(iif([Extended_Price]>=500,1,0)))/Count()"
            UnboundType="Decimal"
            UnboundFieldName="fieldExtendedPriceNew">
            <CellFormat FormatString="p" FormatType="Numeric"></CellFormat>
        </dx:PivotGridField>
    </Fields>
</dx:ASPxPivotGrid>
<dx:ASPxPivotGrid ID="ASPxPivotGrid1" runat="server" DataSourceID="AccessDataSource1"
OnCustomSummary="ASPxPivotGrid1_CustomSummary" Theme="DevEx">
    <Fields>
        <dx:PivotGridField ID="fieldProductName" Area="RowArea" AreaIndex="0"
        Caption="Product Name" FieldName="ProductName">
        </dx:PivotGridField>
        <dx:PivotGridField ID="fieldExtendedPrice" Area="DataArea" AreaIndex="0"
        Caption="Percentage of Orders over $500" SummaryType="Custom"
        CellFormat-FormatString="p" CellFormat-FormatType="Numeric"
        FieldName="Extended_Price">
        </dx:PivotGridField>
    </Fields>
</dx:ASPxPivotGrid>
using DevExpress.Web.ASPxPivotGrid;
using DevExpress.XtraPivotGrid;

namespace ASPxPivotGrid_CustomSummary
{
    public partial class CustomSummaryEventExample : System.Web.UI.Page
    {
        static int minSum = 500;
        protected void ASPxPivotGrid1_CustomSummary(object sender,
                                                    PivotGridCustomSummaryEventArgs e)
        {
            if (e.DataField != fieldExtendedPrice) return;

            // A variable which counts the number of orders whose sum exceeds $500.
            int order500Count = 0;

            // Get the record set for the current cell.
            PivotDrillDownDataSource ds = e.CreateDrillDownDataSource();

            // Iterate through the records and count the orders.
            for (int i = 0; i < ds.RowCount; i++)
            {
                PivotDrillDownDataRow row = ds[i];

                // Get the order's total sum.
                decimal orderSum = (decimal)row[fieldExtendedPrice];
                if (orderSum >= minSum) order500Count++;
            }

            // Calculate the percentage.
            if (ds.RowCount > 0)
            {
                e.CustomValue = (decimal)order500Count / ds.RowCount;
            }
        }
    }
}
Imports DevExpress.Web.ASPxPivotGrid
Imports DevExpress.XtraPivotGrid

Namespace ASPxPivotGrid_CustomSummary
    Partial Public Class CustomSummaryEventExample
        Inherits System.Web.UI.Page

        Private Shared minSum As Integer = 500
        Protected Sub ASPxPivotGrid1_CustomSummary(ByVal sender As Object, ByVal e As PivotGridCustomSummaryEventArgs)
            If e.DataField IsNot fieldExtendedPrice Then
                Return
            End If

            ' A variable which counts the number of orders whose sum exceeds $500.
            Dim order500Count As Integer = 0

            ' Get the record set for the current cell.
            Dim ds As PivotDrillDownDataSource = e.CreateDrillDownDataSource()

            ' Iterate through the records and count the orders.
            For i As Integer = 0 To ds.RowCount - 1
                Dim row As PivotDrillDownDataRow = ds(i)

                ' Get the order's total sum.
                Dim orderSum As Decimal = DirectCast(row(fieldExtendedPrice), Decimal)
                If orderSum >= minSum Then
                    order500Count += 1
                End If
            Next i

            ' Calculate the percentage.
            If ds.RowCount > 0 Then
                e.CustomValue = CDec(order500Count) / ds.RowCount
            End If
        End Sub
    End Class
End Namespace