Indicators Overview
- 2 minutes to read
This document lists the available indicator types in the ASP.NET Chart Control, and explains how to add an indicator to a series collection and how to adjust a separate palette for painting indicators.
The document consists of the following sections.
Indicators Overview
In any 2D XY-series, you can apply additional technical indicators to your data, using the following set of available indicators.
- Regression Lines
- Trend Lines
- Fibonacci Indicators of Different Kinds
- Moving Average and Envelope Indicators of Different Kinds
An individual series can have an unlimited number of indicators of any type.
This feature is of special importance for financial charting, and most of the indicators listed above are primarily used in financial analysis.
To learn more about each indicator type, see the Technical Indicators section of the Financial Charting topic.
Create an Indicator
To create an indicator for a series at design time, do the following.
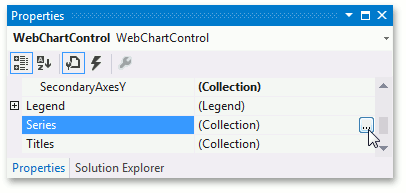
Invoke the Series Collection Editor by clicking the Series ellipsis button in the Properties window.
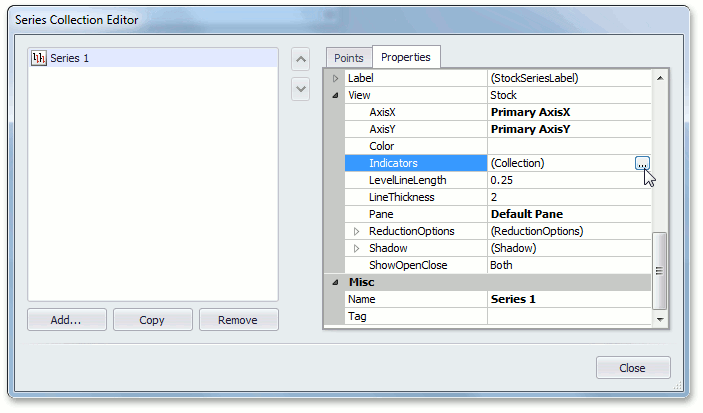
Switch to the Properties tab in the Series Collection Editor, expand the SeriesBase.View property, and click the ellipsis button for the XYDiagram2DSeriesViewBase.Indicators property.
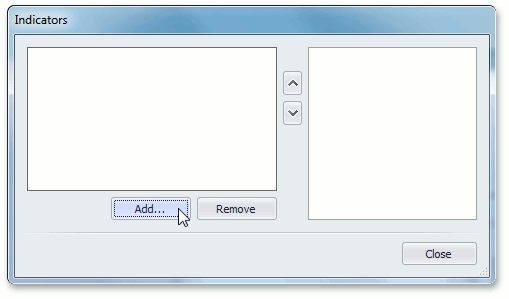
Click the Add… button in the invoked Indicators dialog.
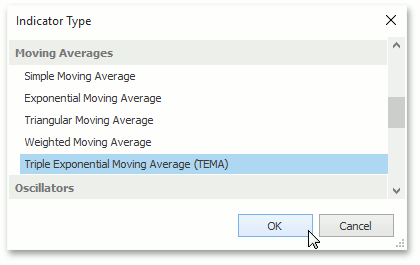
Select the required indicator type, and click OK in the Indicator Type dialog.
Now you can adjust specific options of the indicator in the Indicators dialog.
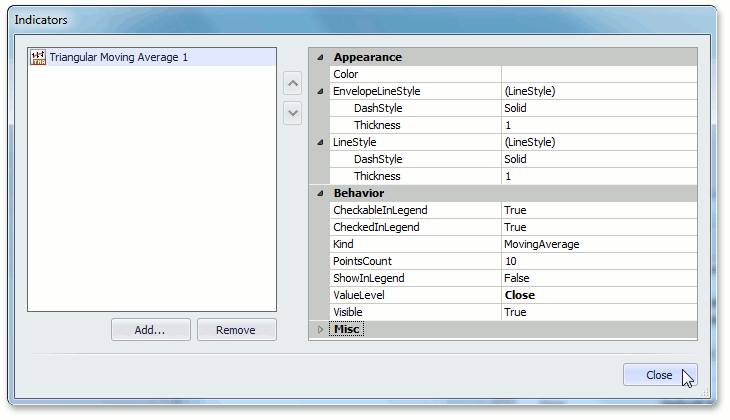
The following are the most important indicator options.
- For the SingleLevelIndicator class descendants (Moving Average and Regression Line), you should specify their SingleLevelIndicator.ValueLevel property.
- For all other indicators, it is necessary to define two data points (FinancialIndicator.Point1 and FinancialIndicator.Point2), through which an indicator should be drawn. In turn, each point is defined by its FinancialIndicatorPoint.Argument and FinancialIndicatorPoint.ValueLevel.
Indicator Appearance
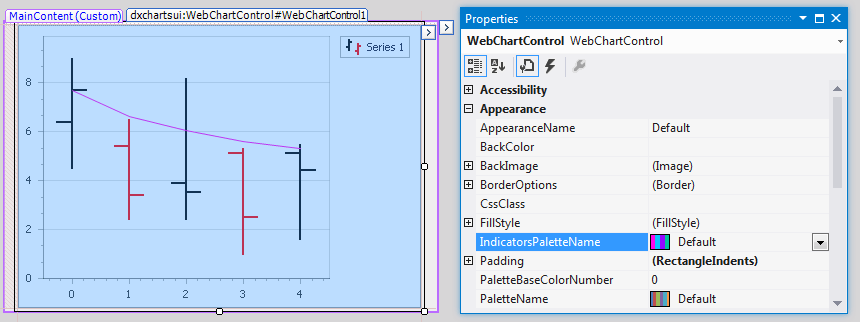
To apply a common appearance for all indicators in your chart, you can use the WebChartControl.IndicatorsPaletteName property. This property defines a distinct appearance for all indicators in the chart control.
If required, you can define your own custom palette for painting indicators, using the approach demonstrated in the Create a Custom Palette topic.