Regression Lines
- 3 minutes to read
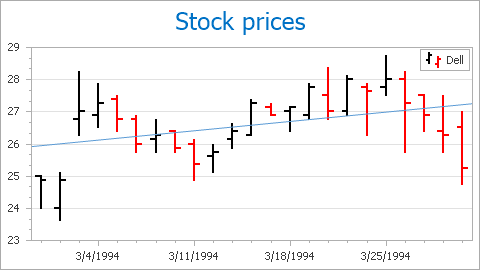
This document describes how a linear regression analysis can be performed over your chart’s visual data using the Regression Line statistical tool.
This document consists of the following sections.
Regression Lines Overview
A Regression Line is a used statistical analysis instrument. Appearing as a line drawn across a chart’s diagram, it is constructed based on the so-called linear regression analysis.
A Regression Line differs from a Trend Line in that is a straight line indicating whether a particular data set has increased or decreased over a period of time. Trend Lines are sometimes used in business analytics to show changes in data over time because they are simple. However, they suffer from a lack of scientific validity in cases where other potential changes can affect the data. Thus, regression lines are a more sophisticated analytical instrument.
Regression Lines determine whether the data suggests some kind of simple function between its variables. (In general, there are one or more independent variables and a single dependent variable, the values of which depend on the values of the other variables). Linear regression analysis involves determining the underlying equation through a method called least squares. This method minimizes the error terms depending on how far away each data point is from the underlying linear function. Thus, the method by minimizes the sum of the squares of the errors.
A Regression Line is represented by an instance of the RegressionLine class (which is a descendant of the Indicator class) and (along with other indicators) resides in the IndicatorCollection of a series returned by the XYDiagram2DSeriesViewBase.Indicators property.
Since a RegressionLine object is inherited from the SingleLevelIndicator class, to draw a Regression Line, you must specify its SingleLevelIndicator.ValueLevel property.
Note
Because a regression line is built upon a specified value level, it is used to deal with either date-time or numerical data. Thus, you cannot create a Regression Line upon series arguments, nor for any data of the qualitative scale type.
The view type of the series to which a Regression Line is assigned is returned by the Indicator.View property.
A series can possess any number of Regression Lines and any number of them can be drawn across the same value level.
Draw a Regression Line
To access a series’ collection of indicators at design time:
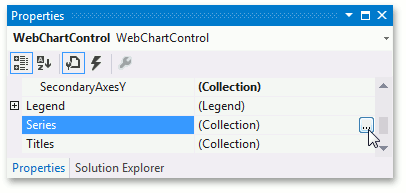
invoke the Series Collection Editor by clicking the Series ellipsis button in the Properties window;
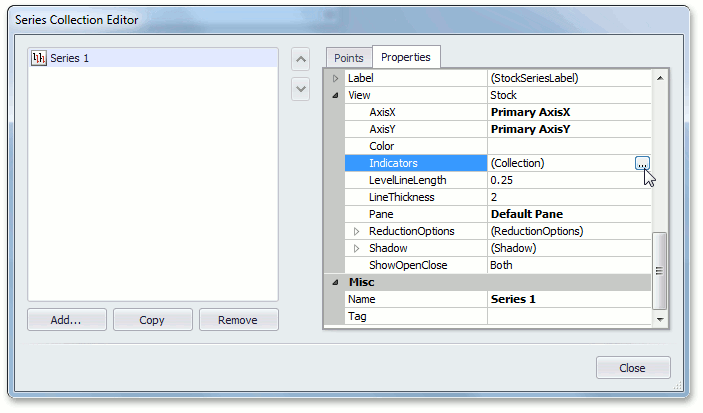
switch to the Properties tab in the Series Collection Editor, expand the SeriesBase.View property, and click the ellipsis button for the XYDiagram2DSeriesViewBase.Indicators property;
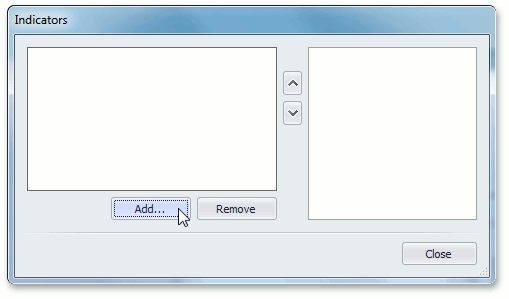
click the Add… button in the invoked Indicators dialog;
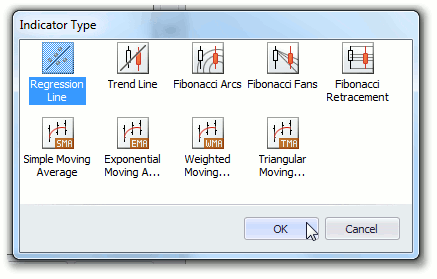
select the Regression Lines type, and click OK in the Indicator Type dialog.
After a Regression Line is created, you can define its SingleLevelIndicator.ValueLevel and other properties in the Indicators dialog.
Note that all the chart’s indicators are painted based on a palette defined via the WebChartControl.IndicatorsPaletteName property.