Simple Diagram 3D
- 4 minutes to read
This document details the specifics of the Simple diagram 3D type. It lists the series view types associated with this diagram type, demonstrates how its specific options can be accessed (both at design and runtime), and briefly describes these options. Before reading this text, you may wish to review the basics of using diagram in the ASP.NET Chart Control.
This document consists of the following sections.
Associated Series View Types
In addition to a wide range of 2D Chart Types, with the WebChartControl it is possible to build most of these charts in an attractive and high-resolution 3D-like style. So, with the Simple diagram 3D type, you can plot series of the Pie 3D and Doughnut 3D view types. A typical example of the Simple diagram 3D is shown in the following image.
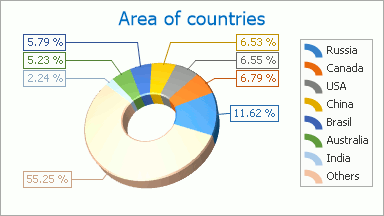
The Pie and Doughnut series are useful when it is necessary to compare the percentage values of different point arguments in the same series. So, the points of a series are distributed along the drawn circle’s radius, which is considered to be 100%. Each slice of this circle represents a portion of the whole series that each point’s value represents.
The Pie and Doughnut series view types are almost identical, the only exception being that the Doughnut series has a hole in its center.
For the 3D diagram types a completely different graphical engine is used, to meet their specific requirements. For this reason, a part of the available functionality is unique (as compared to their 2D analogs), and is supported for these diagram types only. Likewise, it’s impossible to plot 2D and 3D series within the same diagram.
For detailed descriptions of the options available for this diagram type, refer to the following section of this document: Specific Options.
The next section of this document explains how an object of the Simple diagram 3D type can be accessed.
Accessing a Diagram
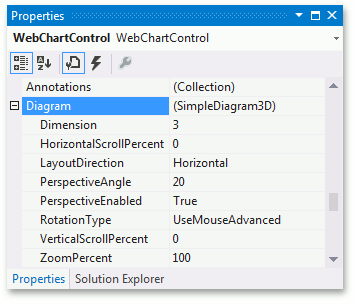
To access the options of a Simple diagram 3D at design time, click your chart, to select it. Then, in the Properties window, expand the WebChartControl.Diagram property.
At runtime, cast your instance of the Diagram object to the SimpleDiagram3D type.
// Create a new WebChartControl instance.
WebChartControl chart = new WebChartControl();

// Create a series of a compatible view type,
// and add it to the chart's collection,
// so the diagram object shall not to be equal to null.
Series series1 = new Series("Pie 3D Series 1", ViewType.Pie3D);
chart.Series.Add(series1);

// Create a diagram, and cast it to the SimpleDiagram3D type.
SimpleDiagram3D diagram = (SimpleDiagram3D)chart.Diagram;
Specific Options
The SimpleDiagram3D.Dimension and SimpleDiagram3D.LayoutDirection properties provide the same functionality as their analogs of the Simple diagram 2D type. These are the only properties which these diagram types have in common. The following category provides properties unique for the 3D diagram types. For more detailed information about them, refer to these properties’ descriptions.
Perspective
In a perspective projection, the lines that are parallel to the object converge as they move towards a theoretical horizon line on the projection surface. The rate at which parallel lines converge is called the perspective angle. This angle is determined by the distance of an imaginary viewer from a 3D diagram object. To enable or disable the 3D perspective, use the Diagram3D.PerspectiveEnabled property. When it is set to true, you can use the Diagram3D.PerspectiveAngle property to define the required angle. Setting the Diagram3D.PerspectiveAngle property to 0 will disable the perspective.
Note
For web charts there is a restriction disallowing use of 3D charts under the Medium Trust permission level. To learn more on this, refer to Medium Trust Support.