Radar and Polar Diagrams
- 4 minutes to read
This document details the specifics of the Radar and Polar diagram types. It lists the series view types associated with this diagram type, demonstrates how its specific options can be accessed (both at design and runtime), and briefly describes these options. Before reading this text, you may wish to review the basics of using diagram in the ASP.NET Chart Control.
This document consists of the following sections.
Associated Series View Types
The Radar and Polar diagrams are used to plot Radar and Polar series.
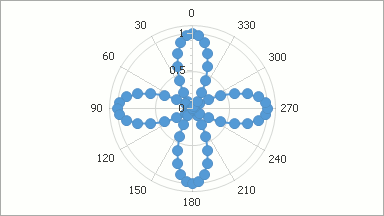
The series of Radar view types (also called Spider or Star charts) are used to display data as a circular graph. A Radar view is drawn on a circular grid, and has multiple axes along which data can be plotted. A typical example of Radar diagram is shown in the following image.
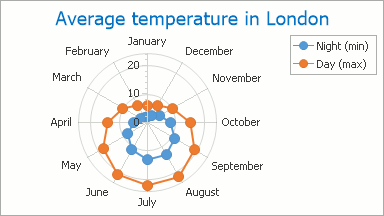
Polar view types are similar to Radar views, but display values on the basis of angles (from 0 to 360 degrees). A typical Polar diagram is shown in the following image.
Below is the list of all available radar and polar series view types.
- Radar Area;
- Radar Line;
- Scatter Radar Line Chart;
- Radar Point;
- Polar Area;
- Polar Line;
- Scatter Polar Line Chart;
- Polar Point.
Note that although these charts normally have a circular shape, they can also be displayed as polygons.
Accessing a Diagram
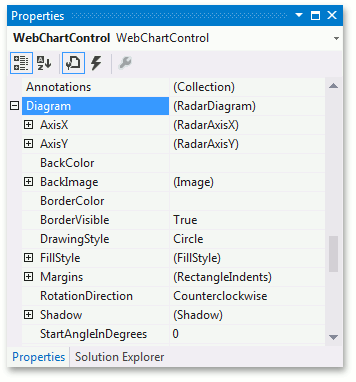
To access the options of a radar or polar diagram at design time, click your chart, to select it. Then, in the Properties window, expand the WebChartControl.Diagram property.
At runtime, cast your instance of the Diagram object to the RadarDiagram (or PolarDiagram) type.
// Create a new WebChartControl instance.
WebChartControl chart = new WebChartControl();

// Create a series of a compatible view type,
// and add it to the chart's collection,
// so the diagram object shall not to be equal to null.
Series series1 = new Series("Radar Area Series 1", ViewType.RadarArea);
chart.Series.Add(series1);

// Create a diagram, and cast it to the RadarDiagram type.
RadarDiagram diagram = (RadarDiagram)chart.Diagram;

// Access the diagram's options.
diagram.DrawingStyle = RadarDiagramDrawingStyle.Polygon;
diagram.RotationDirection = RadarDiagramRotationDirection.Counterclockwise;
Specific Options
The PolarDiagram class is derived from the RadarDiagram class, and its set of properties is identical to the properties of the Radar diagram. For this reason, in this example the available options are demonstrated for the Radar diagram. They are briefly described below. For the more detailed information about them, refer to these properties’ descriptions.
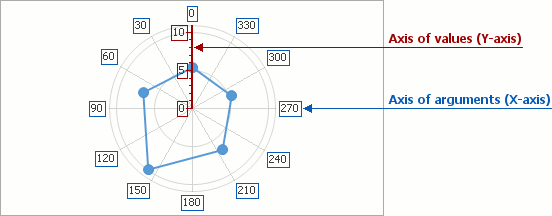
The RadarDiagram.AxisX and the RadarDiagram.AxisY properties provide access to the radar diagram’s axes options. Note that there are unique implementation elements for axes of this diagram type, compared with regular axes. In particular, the axis of arguments (X-axis) corresponds to the circular grid onto which Radar series are plotted. You can select this axis by clicking its labels. For more information, refer to Axes.
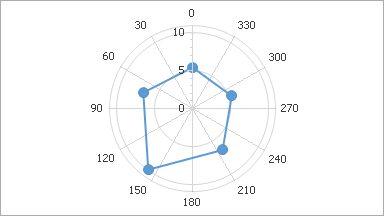
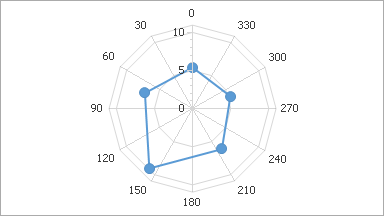
The RadarDiagram.DrawingStyle property determines the shape style of a grid used to plot a Radar chart (RadarDiagramDrawingStyle.Circle or RadarDiagramDrawingStyle.Polygon). The following images demonstrate this property in action.
| DrawingStyle = Circle | DrawingStyle = Polygon |
|---|---|
 |
 |
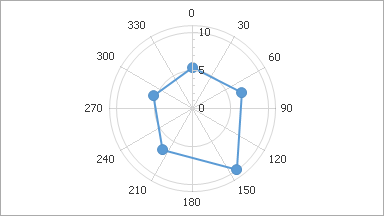
The RadarDiagram.RotationDirection property determines the direction in which the diagram’s X-axis should display the arguments (clockwise or counterclockwise). The following images demonstrate this property in action.
| RotationDirection = Clockwise | RotationDirection = Counterclockwise |
|---|---|
 |
 |
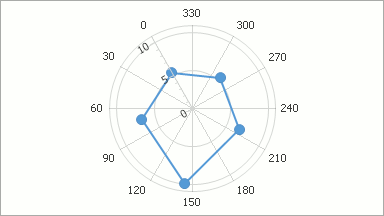
The RadarDiagram.StartAngleInDegrees property determines the angle for the diagram’s X-axis to start drawing. The following images demonstrate this property in action.
| StartAngleInDegrees = 0 | StartAngleInDegrees = 60 |
|---|---|
|
 |
Other diagram properties control its appearance in the following ways.
- The RadarDiagram.BackColor, RadarDiagram.BackImage and RadarDiagram.FillStyle properties determine the background settings of the diagram.
- The RadarDiagram.BorderColor and RadarDiagram.BorderVisible properties determine the diagram’s border settings.
- The RadarDiagram.Shadow property determines the shadow appearance of the diagram.
- The RadarDiagram.Margins property determines the internal space between the body of the diagram and its edge.