Lesson 2 - Create a Data-Aware Report
- 8 minutes to read
This tutorial will guide you through the process of creating a master-detail report using Microsoft® Visual Studio®. You will learn how to add a data-bound report to your application using the Report Wizard and customize the report layout.
Note
Watch the Video: Reporting: Master-Detail Reports (YouTube)
The created report will be platform-agnostic, which means that you can use it later in other applications created on any of the supported platforms.

Tip
To get started with this tutorial, open an existing reporting application or create a new one from scratch. To learn how to create a reporting application on the platform of your choice, see Adding a Report to Your .NET Application.
This tutorial consists of the following sections:
Add a New Report
The following steps illustrate how to create a new report bound to a hierarchical SQL data source and specify a master-detail relationship between data source queries.
Select PROJECT | Add New Item… in the Visual Studio® main menu or press CTRL+SHIFT+A.

In the Add New Item dialog, select the DevExpress v17.2 Report Wizard item and click Add.

In the invoked Report Wizard, select Data-bound Report and click Next.

Note
Refer to the following documents to learn about other report types:
On the next wizard page, you can select a required data source type. Choose Database and click Next to proceed.

Note
Refer to the following documents to learn about binding to other data source types:
On the next wizard page, specify whether you want to use any of the data connections that are already available in the Visual Studio® Server Explorer, or create a new data connection from scratch.

To create a new connection, select the first option and click Next.
On the next page, you can define a custom connection string, or select from the list of supported data providers.
Depending on the data provider selected, it may be necessary to specify additional connection options (such as authentication type and database name) on this page.
For this example, we will bind a report to a sample Northwind database hosted on a Microsoft SQL Server.

To proceed to the next wizard page, click Next.
On the following page, specify whether or not to save the connection string to the application’s configuration file.

If you choose to save the connection string, specify its name and click Next.
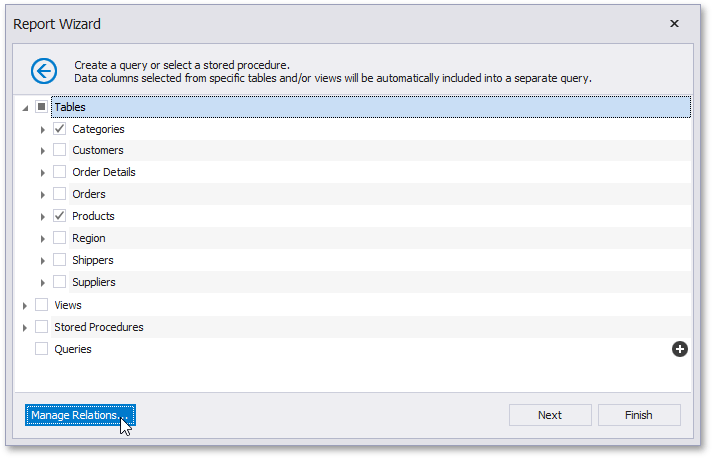
On the next page, you can choose which tables, views and/or stored procedures to add to the report.
To create a master-detail report, select two or more tables and click Manage Relations.
In the invoked editor, connect the required key fields (columns) using drag and drop.
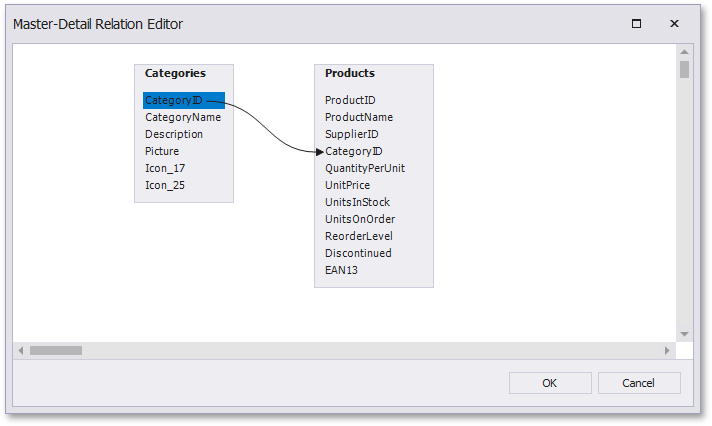
Click OK to close the editor.
Note
When you are required to shape data at the level of a data source, you can create custom queries by expanding the Queries category and clicking the
 button.
This will invoke the Query Builder where you can create complex queries by joining multiple tables, filtering, sorting and grouping their data, as well as calculating various aggregate functions.
Although it is also possible to join different tables within a single query, creating hierarchical data sources is preferred in most cases to provide better performance (in general, master-detail reports are generated faster than similar-looking reports created by grouping “flat” data sources).
You can stop the wizard at this step by clicking Finish to create a blank data-bound report.
To continue report customization, click Next to proceed to the next wizard page.
The default report layout contains three different bands (Top Margin, Detail and Bottom Margin).

These bands cannot be deleted.
- The top and bottom margins are repeated on each document page and in most scenarios should be left blank.
- The Detail band provides space for printing repeated data coming from a report data source. This band is printed as many times as there are records in the report data source.
The following panels provide information about the report and will be used to create the report layout.
Report Explorer | Field List |
|---|---|
The report structure is displayed in the Report Explorer where you can also access the data source settings.
| The hierarchy of the report data source is reflected by the Field List. You can right-click the data source to access its settings.
|


To toggle the visibility of these panels, use the XtraReports Menu:

Construct the Master Report Layout
This document section illustrates how to add report bands and provide content to the report.
Add a Report Header
To quickly add a new band, right-click a report to invoke the context menu. To add a Report Header, select Insert Band | ReportHeader.

Add Static Content
To create a title that will be printed in the beginning of a document, do the following.
Open the Toolbox pane (by pressing CTRL+ALT+X), select the XRLabel control in the DX.17.2: Report Controls tab and drop it onto the Report Header.

Double-click the created label to invoke its in-place editor and type the required text (e.g., “Fall Catalog”). Then, use the XtraReports toolbar to adjust the label’s color and font options.

Add Dynamic Content
To provide dynamic report content that is supplied from a connected data source, add data-bound controls to report bands.
For example, to list product categories along with their descriptions in a report, drag the corresponding fields from the Field List and drop them onto the report’s Detail band.

Then, you can adjust the color and font options of the created labels.
To display images stored in a connected database, right-click the corresponding item in the Field List and drop it onto the report. Choose PictureBox in the invoked context menu.

To specify the size mode for the image, click the control’s smart tag and set the XRPictureBox.Sizing property.

For instance, set this property to ZoomImage to proportionally resize the image within the control (without clipping).
Switch to the Preview tab to view the resulting document.

Construct the Detail Report Layout
This document section describes how to create a hierarchical report displaying specific details under each product category of the master report created in the previous section.
A report can contain any number of detail reports (with each detail report containing any number of nested detail reports), which makes it possible to publish even the most complex hierarchical data.
To create a Detail Report Band, right-click the report to invoke its context menu. Select Insert Detail Report and click the name of the master-detail relationship.
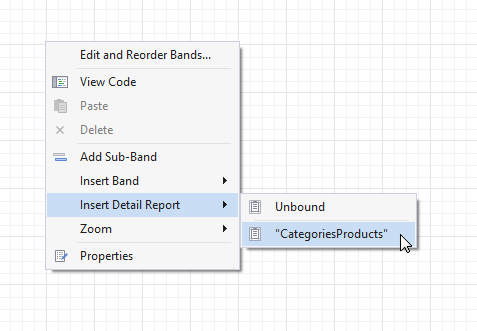
This will create a new Detail Report with its data member set to the corresponding relationship.

A detail report can contain other bands. In this tutorial, we will add a Group Header for displaying captions of data fields contained in the detail report.
To do this, right-click the detail report, and select Insert Band | GroupHeader in the invoked context menu.

To display column captions in the Group Header, click the required fields in the Field List (under the category corresponding to the data relationship assigned as the detail report’s data member) while holding the CTRL key. Then, drag and drop them onto the Group Header using the right mouse button.

To provide dynamic content to the detail report, select the same fields in the Field List and drop them onto the Detail Report band (using the left mouse button).

You can customize the appearance of the created Tables using the Properties window.

To learn how to assign different style settings to alternating table rows in the detail report, see Report Visual Styles.
To apply a currency format to a table cell displaying unit price, click the cell’s smart tag. Then, click the ellipsis button for the Format String property and select an appropriate format in the invoked Format String Editor.

To secure proper location of document content, you can enable the GroupBand.RepeatEveryPage property, and set the GroupHeaderBand.GroupUnion property to WithFirstDetail.

This will make the Group Header repeated on every report page and always printed with at least one Detail band below it.
To have master and detail report content always print on the same page, set the DetailBand.KeepTogetherWithDetailReports property of the master report’s Detail band.

The master-detail report is now ready. Switch to the Preview tab and view the result.
