ChartControl.CustomPaint Event
Occurs after all the chart’s visual elements have been drawn.
Namespace: DevExpress.XtraCharts
Assembly: DevExpress.XtraCharts.v21.2.UI.dll
NuGet Packages: DevExpress.Win.Charts, DevExpress.Win.Design
Declaration
Event Data
The CustomPaint event's data class is CustomPaintEventArgs. The following properties provide information specific to this event:
| Property | Description |
|---|---|
| Bounds | Gets the bounds of a custom graphic object. |
| Graphics | Gets the custom graphic object. |
Remarks
Use the CustomPaint event to draw custom graphics over your chart.
Cast the Event Args object to the DXCustomPaintEventArgs class and use its DXCustomPaintEventArgs.Cache property to draw custom content in the control surface correctly in DirectX mode. Note that this property also allows you to draw custom content in GDI+ mode.
For example, the XYDiagram2D.DiagramToPoint and RadarDiagram.DiagramToPoint methods allow you to draw custom content tied to existing chart elements (series, series points and so on) when you utilize them in the event handler.
Important
Changes made by the event handler do not affect 3D charts.
Examples
How to: Show a Custom Image on a Chart
This example demonstrates how to use the DXCustomPaintEventArgs class to display a custom image over the chart.
public partial class MainForm : XtraForm {
    static readonly Image logo = new Bitmap("../../Images/DXLogo.png");

    public MainForm() {
        InitializeComponent();

        chartControl.CustomPaint += this.OnChartCustomPaint;
    }

    private void OnChartCustomPaint(object sender, CustomPaintEventArgs e) {
        if (!(e is DXCustomPaintEventArgs dxArgs)) return;
        dxArgs.Cache.DrawImage(logo, new Point(10, 10));
    }
}
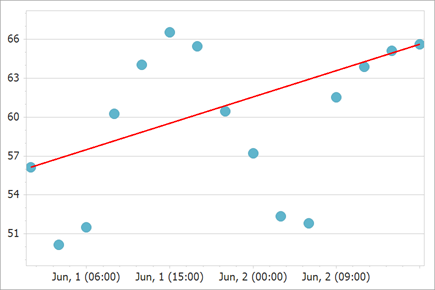
How to: Draw a Line Between Two Chart Points
TThe following example shows how to draw a line between the first and last series points. You can use the same approach to draw other shapes on the chart surface.
using DevExpress.XtraCharts;
using System;
using System.Collections.Generic;
using System.Drawing;
using System.Linq;

namespace CustomPaintSample {
    public partial class Form1 : DevExpress.XtraEditors.XtraForm {
        public Form1() {
            InitializeComponent();
        }
        private void Form1_Load(object sender, EventArgs e) {

            Series series = new Series("Series", ViewType.Point);
            series.DataSource = DataPoint.GetDataPoints();
            series.ArgumentDataMember = "Date";
            series.ValueDataMembers.AddRange("Value");
            chartControl1.Series.Add(series);

            PointSeriesView view = (PointSeriesView)series.View;
            view.PointMarkerOptions.Size = 20;

            XYDiagram diagram = chartControl1.Diagram as XYDiagram;
            diagram.AxisX.Label.TextPattern = "{A:MMM, d (HH:mm)}";
            diagram.AxisX.DateTimeScaleOptions.MeasureUnit = DateTimeMeasureUnit.Hour;
            diagram.AxisX.DateTimeScaleOptions.GridSpacing = 9;
            diagram.AxisX.WholeRange.SideMarginsValue = 0.5;
            diagram.AxisY.WholeRange.AlwaysShowZeroLevel = false;

            chartControl1.Legend.Visibility = DevExpress.Utils.DefaultBoolean.False;

            chartControl1.CustomPaint += Chart_CustomPaint;
            chartControl1.BoundDataChanged += ChartControl1_BoundDataChanged;
        }


        SeriesPoint startSeriesPoint, endSeriesPoint;

        // Obtain coordinates of points used as start and end line points.
        private void ChartControl1_BoundDataChanged(object sender, EventArgs e) {

            XYDiagram diagram = (XYDiagram)chartControl1.Diagram;
            startSeriesPoint = chartControl1.Series[0].Points[0];
            endSeriesPoint = chartControl1.Series[0].Points.Last() as SeriesPoint;

        }
        // Draw a line.
        private void Chart_CustomPaint(object sender, CustomPaintEventArgs e) {
            Point startPoint, endPoint;
            XYDiagram diagram = (XYDiagram)chartControl1.Diagram;

            DateTime arg1 = startSeriesPoint.DateTimeArgument;
            double val1 = startSeriesPoint.Values[0];
            startPoint = diagram.DiagramToPoint(arg1, val1).Point;

            DateTime arg2 = endSeriesPoint.DateTimeArgument;
            double val2 = endSeriesPoint.Values[0];
            endPoint = diagram.DiagramToPoint(arg2, val2).Point;

            DXCustomPaintEventArgs args = (DXCustomPaintEventArgs)e;
            if (startPoint != null && endPoint != null) {
                args.Cache.DrawLine(startPoint, endPoint, Color.Red, 3);
            }

        }
        public class DataPoint {
            public DateTime Date { get; set; }
            public double Value { get; set; }
            public DataPoint(DateTime date, double value) {
                this.Date = date;
                this.Value = value;
            }
            public static List<DataPoint> GetDataPoints() {
                List<DataPoint> data = new List<DataPoint> {
                new DataPoint(new DateTime(2022, 6, 1, 0, 0, 0), 56.1226),
                new DataPoint(new DateTime(2022, 6, 1, 3, 0, 0), 50.18432),
                new DataPoint(new DateTime(2022, 6, 1, 6, 0, 0), 51.51443),
                new DataPoint(new DateTime(2022, 6, 1, 9, 0, 0), 60.2624),
                new DataPoint(new DateTime(2022, 6, 1, 12, 0, 0), 64.04412),
                new DataPoint(new DateTime(2022, 6, 1, 15, 0, 0), 66.56123),
                new DataPoint(new DateTime(2022, 6, 1, 18, 0, 0), 65.48127),
                new DataPoint(new DateTime(2022, 6, 1, 21, 0, 0), 60.4412),
                new DataPoint(new DateTime(2022, 6, 2, 0, 0, 0), 57.2341),
                new DataPoint(new DateTime(2022, 6, 2, 3, 0, 0), 52.3469),
                new DataPoint(new DateTime(2022, 6, 2, 6, 0, 0), 51.82341),
                new DataPoint(new DateTime(2022, 6, 2, 9, 0, 0), 61.532),
                new DataPoint(new DateTime(2022, 6, 2, 12, 0, 0), 63.8641),
                new DataPoint(new DateTime(2022, 6, 2, 15, 0, 0), 65.12374),
                new DataPoint(new DateTime(2022, 6, 2, 18, 0, 0), 65.6321)};
                return data;
            }
        }
    }
}