Annotations
- 8 minutes to read
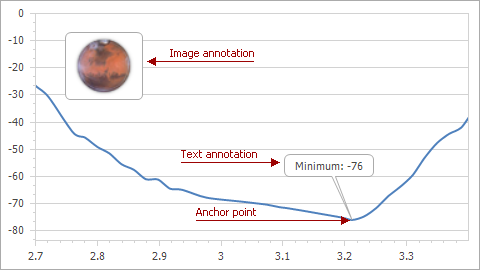
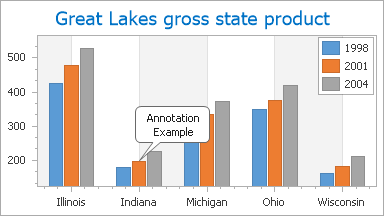
An annotation is a comment with information about a chart’s content. The Chart Control supports text and image annotations. You can add annotations for a chart, pane, or series point.
Add Annotations
Design-Time
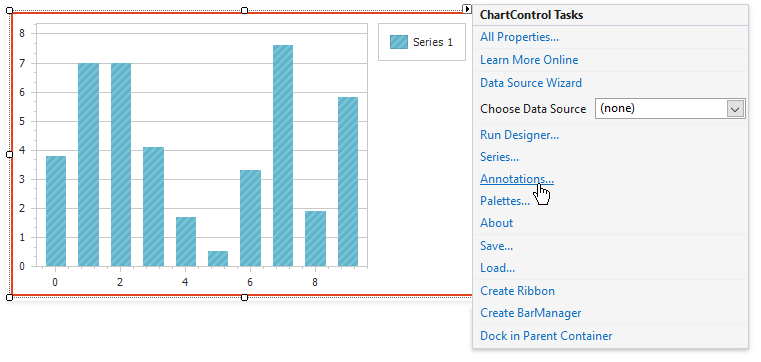
Use the chart control’s smart tag to add annotations at design time. Click the Annotations… link in the actions list.
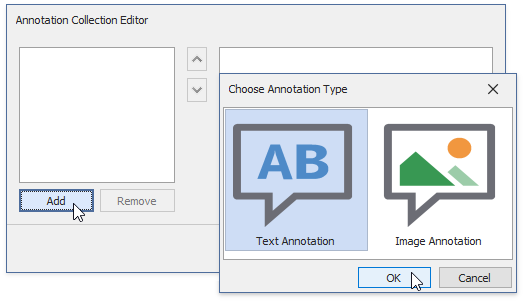
Click Add in the Annotation Collection Editor and select the annotation’s type.
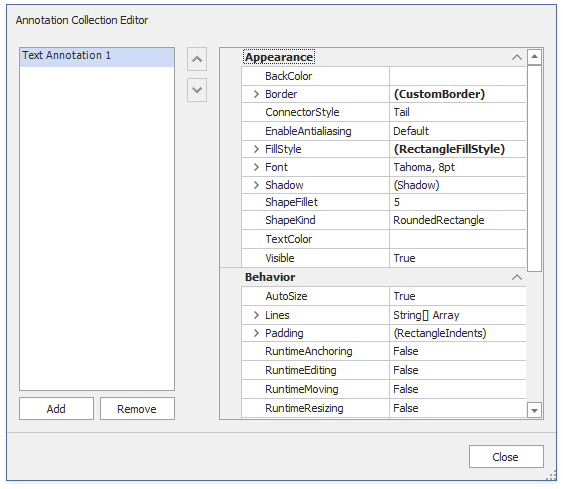
You can specify other annotation options in the Annotation Collection Editor. See the following help topic for more information: How to: Create a Text Annotation Anchored to a Series Point.
Runtime (Code)
The ChartControl.AnnotationRepository property contains all annotations specified for different chart elements. Use the following code to add an annotation:
Tip
See the following repository for a complete sample project that demonstrates how to add annotations: https://github.com/DevExpress-Examples/how-to-accompany-a-chart-its-pane-or-series-point-by-text-or-image-annotations-e2188.
Runtime (Ribbon UI)
Users can create interactive text and image annotations via the Add Text Annotation and Add Image Annotation buttons in the Chart’s Ribbon or Toolbars.
Anchor Point
Use the Annotation.AnchorPoint property to anchor an annotation to the Chart Control, pane, or series point.
Chart Anchor Point

Set the Annotation.AnchorPoint property to ChartAnchorPoint to anchor the annotation to the Chart Control. Use the ChartAnchorPoint.X and ChartAnchorPoint.Y properties to position the anchor point. These properties specify the distance between the chart’s left and top edges, and the anchor point. Use the ChartControl.Annotations property to access chart annotations.
TextAnnotation textAnnotation = (TextAnnotation)chartControl1.AnnotationRepository.GetElementByName("Annotation1");
textAnnotation.AnchorPoint= new ChartAnchorPoint();
// Define the X and Y absolute coordinates in pixels.
((ChartAnchorPoint)chartControl1.Annotations[0].AnchorPoint).X = 150;
((ChartAnchorPoint)chartControl1.Annotations[0].AnchorPoint).Y = 150;
The following help topic describes how to add annotations in Visual Studio’s Design View: How to: Create an Image Annotation Anchored to a Chart or Pane.
Pane Anchor Point

Set the Annotation.AnchorPoint property to PaneAnchorPoint to anchor the annotation to a pane. Use the PaneAnchorPoint.Pane property to specify the pane for the annotation. Set the PaneAnchorPoint.AxisXCoordinate and PaneAnchorPoint.AxisYCoordinate properties to define anchor point coordinates.
Use the XYDiagramPaneBase.Annotations property to access the pane’s annotations.
XYDiagramDefaultPane myPane = ((XYDiagram)chartControl1.Diagram).DefaultPane;
TextAnnotation textAnnotation = new TextAnnotation("Annotation1");
textAnnotation.AnchorPoint = new PaneAnchorPoint();
((PaneAnchorPoint)textAnnotation.AnchorPoint).Pane = myPane;
// Define axis coordinates of the anchor point.
((PaneAnchorPoint)myPane.Annotations[0].AnchorPoint).AxisXCoordinate.AxisValue = 20;
((PaneAnchorPoint)myPane.Annotations[0].AnchorPoint).AxisYCoordinate.AxisValue = 180;
If you remove the pane specified as an anchor point, anchored annotations are removed with this pane.
Series Point Anchor Point
Set the Annotation.AnchorPoint property to SeriesPointAnchorPoint to anchor the annotation to a series point. Specify the SeriesPointAnchorPoint.SeriesPoint property to define the series point to anchor the annotation, and use the SeriesPoint.Annotations property to access series point annotations.
private void ChartLine_BoundDataChanged(object sender, EventArgs e) {
   TextAnnotation textAnnotation = (TextAnnotation)chartControl1.AnnotationRepository.GetElementByName("Annotation1");
   SeriesPoint seriesPoint = chartControl1.Series[0].Points[2];
   textAnnotation.AnchorPoint = new SeriesPointAnchorPoint(seriesPoint);
   ((TextAnnotation)seriesPoint.Annotations[0]).Text= string.Format("Value={0}", seriesPoint.Values[0].ToString());
 }
If you remove the series point specified as an anchor point, anchored annotations are removed with this series point.
The following help topic describes how to add annotations in Visual Studio’s Design View: How to: Create a Text Annotation Anchored to a Series Point.
Appearance Options
Shape
Use the Annotation.ShapeKind property to specify an annotation shape:
| Ellipse | Rectangle | Rounded Rectangle |
|---|---|---|
 |
 |
 |
If you set Annotation.ShapeKind to ShapeKind.RoundedRectangle, use the Annotation.ShapeFillet property to specify the border radius.
Connector Style
Use the Annotation.ConnectorStyle property to change the connector type:
| None | Tail | Arrow | Notched Arrow | Line |
|---|---|---|---|---|
 |
 |
 |
 |
Paddings
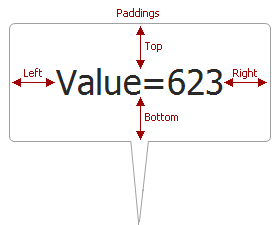
Specify the Annotation.Padding property to define indents between annotation’s contents and its edges.
myAnnotation.Padding.Top = 10;
myAnnotation.Padding.Bottom = 5;
myAnnotation.Padding.Left = 5;
myAnnotation.Padding.Right = 5;
Text Format
Use the TextAnnotation.Font, TextAnnotation.TextAlignment, and TextAnnotation.TextColor properties to format a text annotation.
myAnnotation.Font = new Font("Arial", 8F, FontStyle.Bold);
myAnnotation.TextAlignment = StringAlignment.Center;
myAnnotation.TextColor = Color.DarkRed;
Background Color, Border and Shadow
Set the Annotation.BackColor and Annotation.FillStyle properties to specify the background color and fill style.
myAnnotation.BackColor = Color.LightGray;
myAnnotation.FillStyle.FillMode = FillMode.Gradient;
Use the Annotation.Border property to specify border settings. Set the Annotation.Shadow property to add a shadow to the annotation.
myAnnotation.Border.Color = Color.DarkGray;
myAnnotation.Border.Thickness= 2;
myAnnotation.Shadow.Visible = true;
Annotation Position
The Annotation.ShapePosition property specifies the annotation’s position:
Position | Description | |
|---|---|---|
The annotation is positioned relative to the parent element (a chart or pane). |
| |
The annotation is positioned relative to its anchor point. |
|
Free Position
Set the Annotation.ShapePosition property to FreePosition. Use the FreePosition.DockTarget property to specify the parent: the Chart Control or a pane. Use the FreePosition.DockCorner property to specify the parent’s corner to dock the annotation.
 XYDiagramPaneBase myPane = ((XYDiagram)chartControl1.Diagram).Panes[0];
// Position the chart's annotation in myPane's top right corner
((FreePosition)chartControl1.Annotations[0].ShapePosition).DockTarget = myPane;
((FreePosition)chartControl1.Annotations[0].ShapePosition).DockCorner = DockCorner.RightTop;
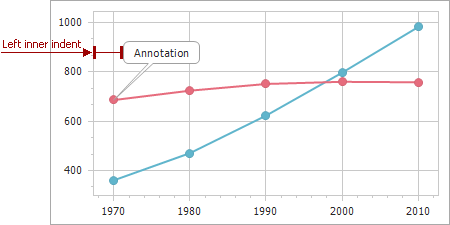
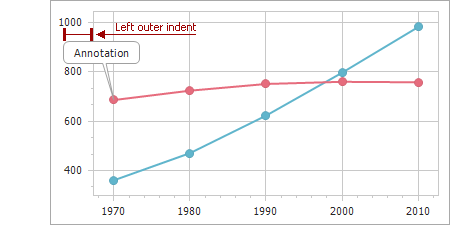
Use the FreePosition.InnerIndents and FreePosition.OuterIndents properties to specify the annotation’s indents from the parent element.
| The Property Value | The Resulting Image |
|---|---|
| InnerIndents.Left = 30 DockTarget = Pane DockCorner=LeftTop |
 |
| OuterIndents.Left = 30 DockTarget = Pane DockCorner=LeftTop |
 |
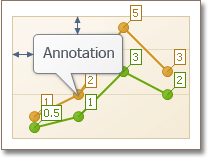
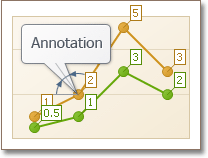
Relative Position
Set the Annotation.ShapePosition property to RelativePosition. Use the RelativePosition.Angle property to specify the annotation’s rotation.
| The Property Value | The Resulting Image |
|---|---|
| RelativePosition.Angle = 0 | 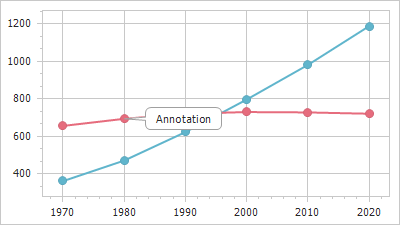 |
| RelativePosition.Angle = 90 | 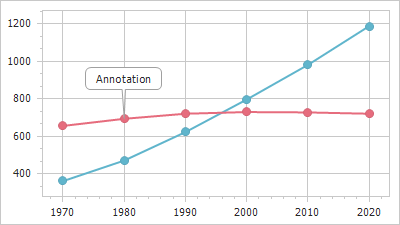 |
Set the RelativePosition.ConnectorLength property to specify the length of the connector.
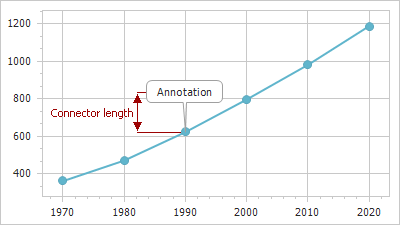
// Specify angle (45) and connector length (40) in the constructor.
chartControl1.Annotations[0].ShapePosition = new RelativePosition( 45, 40);

//Use properties to set angle and connector length.
RelativePosition relativePosition = new RelativePosition();
relativePosition.Angle = 45;
relativePosition.ConnectorLength = 40;
chartControl1.Annotations[1].ShapePosition = relativePosition;
Customize Layout
Label Mode
The control cuts off annotations that do not fit the chart dimensions. Set the Annotation.LabelMode property to true to display the entire annotation.
| The Property Value | The Resulting Image |
|---|---|
| Annotation.LabelMode = false |  |
| Annotation.LabelMode = true | 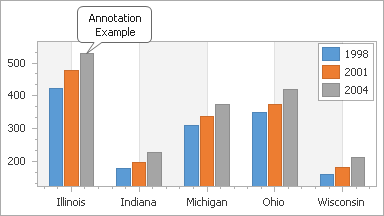 |
SeriesPoint seriesPoint = chartControl1.Series[0].Points[2];
seriesPoint.Annotations[0].LabelMode = true;
Refer to the following help topic for information on label mode limitations: Annotation.LabelMode.
Annotation Size
Use the ImageAnnotation.SizeMode property to specify the size of an image annotation. When the SizeMode property is set to AutoSize, the annotation is automatically resized to fit the image. When the SizeMode property is set to any other ChartImageSizeMode value, the Annotation.Height and Annotation.Width properties define annotation size.
((ImageAnnotation)chartControl1.Annotations[1]).SizeMode = ChartImageSizeMode.Zoom;
((ImageAnnotation)chartControl1.Annotations[1]).Width = 150;
((ImageAnnotation)chartControl1.Annotations[1]).Height = 100;
Use the TextAnnotation.AutoSize property to specify whether the annotation should be resized to fit the text. When you disable the AutoSize property, the Annotation.Height and Annotation.Width properties specify annotation size.
((TextAnnotation)chartControl1.Annotations[0]).AutoSize = false;
((TextAnnotation)chartControl1.Annotations[0]).Width = 100;
((TextAnnotation)chartControl1.Annotations[0]).Height = 50;
Rotate Annotations
Use the Annotation.Angle property to rotate the annotation.
| The Property Value | The Resulting Image |
|---|---|
| Annotation.Angle = 0 | 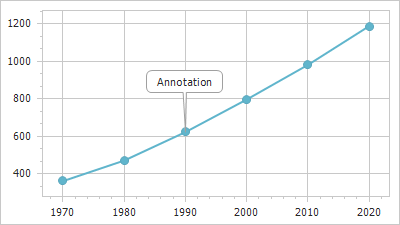 |
| Annotation.Angle = 45 | 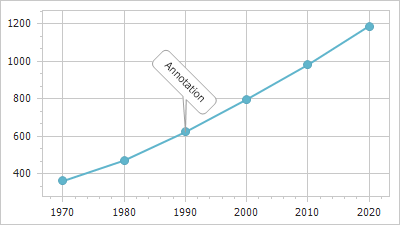 |
SeriesPoint seriesPoint = chartControl1.Series[0].Points[2];
seriesPoint.Annotations[0].Angle = 45;
Z-order
When multiple annotations are displayed, you can determine their Z-order with the Annotation.ZOrder property.
End-User Capabilities
Enable the following options to allow users to customize annotations:
Annotation.RuntimeAnchoring allows users to relocate anchor points. The Annotation.RuntimeAnchoring option is only available for ChartAnchorPoint or PaneAnchorPoint.
Annotation.RuntimeMoving allows users to move the annotation.
Annotation.RuntimeResizing allows users to resize the annotation.
Annotation.RuntimeRotation enables the rotation.
Annotation.RuntimeEditing allows users to edit text and replace images, or use the Delete key to delete the annotation.
chartControl1.Annotations[0].RuntimeAnchoring = true;
chartControl1.Annotations[0].RuntimeMoving = true;
chartControl1.Annotations[0].RuntimeResizing = true;
chartControl1.Annotations[0].RuntimeRotation = true;
chartControl1.Annotations[0].RuntimeEditing = true;
You can handle the ChartControl.AnnotationRepositoryChanging and ChartControl.AnnotationRepositoryChanged events to process user actions. The following example prevents Annotation1 from being deleted:
void chartControl1_AnnotationRepositoryChanging(object sender, AnnotationRepositoryChangingEventArgs e) {
    if (e.Annotation.Name == "Annotation1" && e.Change == AnnotationRepositoryChange.Deletion) {
        e.Cancel = true;
    }
}