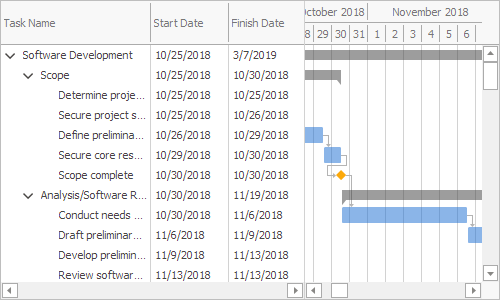
The GanttControl represents a Gantt chart — a bar chart that illustrates a project schedule. The control consists of a task list and a chart that shows task start and finish dates, progress, and dependencies.
Learn the Basics
Data Source
|
Data Source
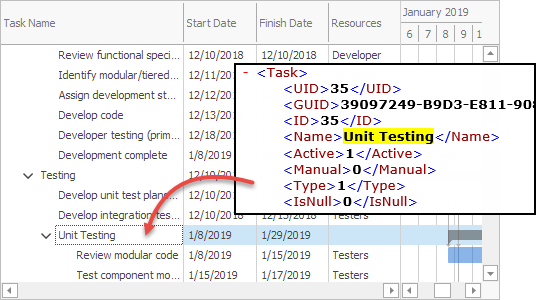
Learn how to bind the control to a data source and specify the data source fields that contain task names, start and finish dates, dependencies, etc. The control supports multiple data source types.
|
Customization
|
Tasks, Summaries, and Milestones
The control supports regular tasks, summary tasks, and milestones.
Task Dependencies
The control supports finish-to-start, finish-to-finish, start-to-start, and start-to-finish dependencies.
Task Progress
A task’s progress is a value that indicates the percentage of work completed.
Interactive Editing and Automatic Scheduling
Users can use the mouse to edit tasks in the chart.
Workweek Schedule and Exceptions
Specify a regular workweek rule and exceptions.
Timescale
Specify measure units, zoom mode, etc.
View Options and Appearances
Use appearance settings to customize background colors for working and non-working hours, timescale ruler, etc.
Localization
Localize captions and date-time formats.
Ribbon Commands
Display Gantt control commands in a Ribbon control.
|