Lesson 3 - Create a Funnel Chart
- 4 minutes to read
This lesson explains how to create a Funnel chart, bind it to data, add a legend, and customize funnel point labels.
Before you proceed, review the following topics:
- Windows UI Library 3
- Get Started with WinUI 3 for Desktop Apps
- DevExpress WinUI Controls: Get Started
Create a New Project
Create a new Blank App, Packaged with Windows Application Packaging Project (WinUI 3 in Desktop) project and add the DevExpress.WinUI NuGet package.
Refer to the following topic for more information on how to create a new project: DevExpress WinUI Controls: Get Started.
Add a Data Model
In the MainWindow.xaml.cs, add a new DataPoint class that defines a data model:
public class DataPoint {
    public string Argument { get; set; }
    public double Value { get; set; }
}
Add a View Model
In the MainWindow.xaml.cs, add a new ChartViewModel class that specifies a view model:
public class ChartViewModel : ViewModelBase {
    public ChartViewModel() {
        List<DataPoint> dataPoints = new List<DataPoint> {
            new DataPoint() { Argument = "Visited a Website",    Value = 9152 },
            new DataPoint() { Argument = "Downloaded a Trial",   Value = 6870 },
            new DataPoint() { Argument = "Contacted to Support", Value = 5121 },
            new DataPoint() { Argument = "Subscribed",           Value = 2224 },
            new DataPoint() { Argument = "Renewed",              Value = 1670 }
        };
        DataPoints = dataPoints;
    }
    public List<DataPoint> DataPoints { get; }
}
In the MainWindow.xaml, specify the window’s data context as follows:
<Window>
    <Grid>
        <Grid.DataContext>
            <local:ChartViewModel/>
        </Grid.DataContext>
        <!--...-->
    </Grid>
</Window>
Add the FunnelChart Control to the Window
Add a FunnelChart instance to the window:
<Window
    xmlns:Charts="using:DevExpress.WinUI.Charts">
    <Grid>
    <!--...-->
        <Charts:FunnelChart>
            <!--...-->
        </Charts:FunnelChart>
    </Grid>
</Window>
Add a Series and Bind it to Data
Add a FunnelSeries object to the FunnelChart.Series collection.
To bind the series to data, initialize the FunnelSeries.Data property with a DataSource object and define its settings:
- Bind DataSource.PointSource to the view model’s
DataPointsproperty. - Use the DataSource.ArgumentDataMember and DataSource.ValueDataMember properties to specify the data members for series arguments and values.
- Bind DataSource.PointSource to the view model’s
Initialize the FunnelSeries.View property with a FunnelSeriesView object to access view settings:
Use the FunnelSeriesView.PointDistance property to specify indents between funnel points.
Define the SeriesView.LegendPointPattern property to format text displayed for each series point in the legend.
Set the SeriesView.ShowLabels property to True to enable labels for points.
To customize label settings, specify the SeriesView.LabelPattern and FunnelSeriesView.LabelPosition properties to customize label text and position.
Specify the FunnelSeriesView.Title property to add an individual title for the funnel series. To customize the title’s appearance, define the FunnelSeriesView.TitleContentTemplate property.
<Charts:FunnelChart>
    <Charts:FunnelChart.Series>
        <Charts:FunnelSeries>
            <Charts:FunnelSeries.Data>
                <Charts:DataSource PointSource="{Binding DataPoints}"
                                   ArgumentDataMember="Argument"
                                   ValueDataMember="Value"/>
            </Charts:FunnelSeries.Data>
            <Charts:FunnelSeries.View>
                <Charts:FunnelSeriesView PointDistance="10"
                                         ShowLabels="True"
                                         LabelPattern="{}{A}: {VP:p2}"
                                         LabelPosition="LeftColumn"
                                         Title="Website Visitors"
                                         LegendPointPattern="{}{A}: {V}">
                    <Charts:FunnelSeriesView.TitleContentTemplate>
                        <DataTemplate>
                            <TextBlock Text="{Binding}"
                                       FontSize="18"
                                       Margin="20"/>
                        </DataTemplate>
                    </Charts:FunnelSeriesView.TitleContentTemplate>
                </Charts:FunnelSeriesView>
            </Charts:FunnelSeries.View>
        </Charts:FunnelSeries>
    </Charts:FunnelChart.Series>
</Charts:FunnelChart>
Add a Legend
Initialize the ChartBase.Legend property with a Legend object.
Use the HorizontalPosition and VerticalPosition properties to specify the legend’s position.
Set Legend.Orientation to Vertical to put legend items in a column.
Specify the legend margin.
<Charts:FunnelChart.Legend>
    <Charts:Legend HorizontalPosition="Right"
                   VerticalPosition="Center"
                   Orientation="Vertical"
                   Margin="40,0,0,0"/>
</Charts:FunnelChart.Legend>
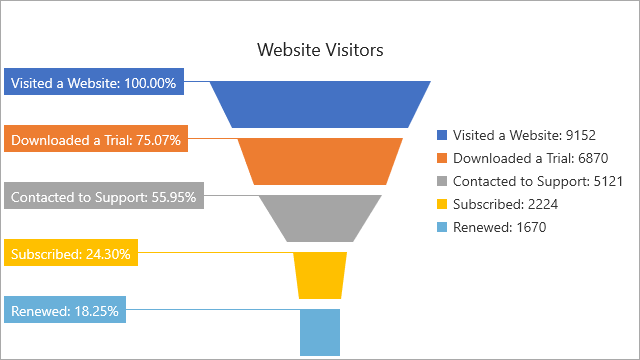
Results
The chart is ready. Your code and XAML should look as follows:
<Window
    x:Class="FunnelChartSample.MainWindow"
    xmlns="http://schemas.microsoft.com/winfx/2006/xaml/presentation"
    xmlns:x="http://schemas.microsoft.com/winfx/2006/xaml"
    xmlns:local="using:FunnelChartSample"
    xmlns:d="http://schemas.microsoft.com/expression/blend/2008"
    xmlns:mc="http://schemas.openxmlformats.org/markup-compatibility/2006"
    xmlns:Charts="using:DevExpress.WinUI.Charts"
    mc:Ignorable="d">
    <Grid>
        <Grid.DataContext>
            <local:ChartViewModel/>
        </Grid.DataContext>
        <Charts:FunnelChart>
            <Charts:FunnelChart.Series>
                <Charts:FunnelSeries>
                    <Charts:FunnelSeries.Data>
                        <Charts:DataSource PointSource="{Binding DataPoints}"
                                           ArgumentDataMember="Argument"
                                           ValueDataMember="Value"/>
                    </Charts:FunnelSeries.Data>
                    <Charts:FunnelSeries.View>
                        <Charts:FunnelSeriesView PointDistance="10"
                                                 ShowLabels="True"
                                                 LabelPattern="{}{A}: {VP:p2}"
                                                 LabelPosition="LeftColumn"
                                                 Title="Website Visitors"
                                                 LegendPointPattern="{}{A}: {V}">
                            <Charts:FunnelSeriesView.TitleContentTemplate>
                                <DataTemplate>
                                    <TextBlock Text="{Binding}"
                                               FontSize="18"
                                               Margin="20"/>
                                </DataTemplate>
                            </Charts:FunnelSeriesView.TitleContentTemplate>
                        </Charts:FunnelSeriesView>
                    </Charts:FunnelSeries.View>
                </Charts:FunnelSeries>
            </Charts:FunnelChart.Series>
            <Charts:FunnelChart.Legend>
                <Charts:Legend HorizontalPosition="Right"
                               VerticalPosition="Center"
                               Orientation="Vertical"
                               Margin="40,0,0,0"/>
            </Charts:FunnelChart.Legend>
        </Charts:FunnelChart>
    </Grid>
</Window>
using DevExpress.Mvvm;
using Microsoft.UI.Xaml;
using System.Collections.Generic;

namespace FunnelChartSample {
    public sealed partial class MainWindow : Window {
        public MainWindow() {
            this.InitializeComponent();
        }
    }
    public class DataPoint {
        public string Argument { get; set; }
        public double Value { get; set; }
    }
    public class ChartViewModel : ViewModelBase {
        public ChartViewModel() {
            List<DataPoint> dataPoints = new List<DataPoint> {
                new DataPoint() { Argument = "Visited a Website",    Value = 9152 },
                new DataPoint() { Argument = "Downloaded a Trial",   Value = 6870 },
                new DataPoint() { Argument = "Contacted to Support", Value = 5121 },
                new DataPoint() { Argument = "Subscribed",           Value = 2224 },
                new DataPoint() { Argument = "Renewed",              Value = 1670 }
            };
            DataPoints = dataPoints;
        }
        public List<DataPoint> DataPoints { get; }
    }
}
Run the project. The following image illustrates the resulting chart: