Lesson 3 - Creating a Funnel Chart
- 3 minutes to read
This lesson demonstrates how to create a Funnel chart with a single Funnel series, populate the chart with data and adjust common settings.
Do the following to create a simple chart application.
- Step 1. Create a New Project and Add a Chart
- Step 2. Provide Chart Data
- Step 3. Customize the Chart
- Result
Step 1. Create a New Project and Add a Chart
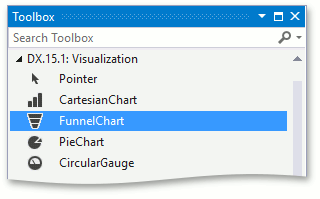
Run MS Visual Studio 2017. Create a new Universal Windows Platform application by choosing New Project from the File menu or by pressing Ctrl+Shift+N. Next, select Universal, and then choose Blank App (Universal Windows). Name this application “FunnelChartLesson” and click OK. Switch to the MainPage.xaml design view and add the FunnelChart control to the main page by dragging and dropping the FunnelChart item from the DX.19.2: Visualization toolbox tab.
Note
The following SDK extensions will be added to the References list of your project: DevExpress.Core and DevExpress.Visualization.
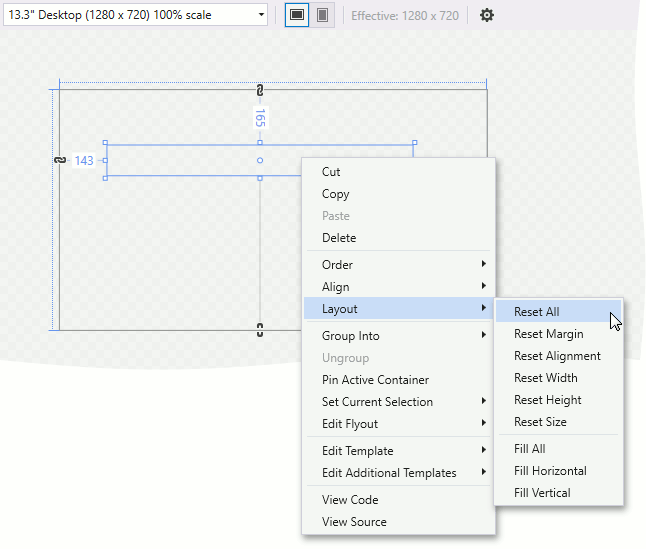
Right-click the FunnelChart object and choose the Layout | Reset All option in the context menu. This will stretch the chart to fill the entire window.
Your XAML should look like the following. If it doesn’t, you can overwrite your code as follows.
<Page
    xmlns="http://schemas.microsoft.com/winfx/2006/xaml/presentation"
    xmlns:x="http://schemas.microsoft.com/winfx/2006/xaml"
    xmlns:Charts="using:DevExpress.UI.Xaml.Charts"
    x:Class="FunnelChartLesson.MainPage">

    <Grid Background="{ThemeResource ApplicationPageBackgroundThemeBrush}">
        <Charts:FunnelChart/>
    </Grid>
</Page>
Proceed to the next step, and learn how to add a series to the chart and provide series points with data.
Step 2. Provide Chart Data
First, you need to fill the chart with data. Begin by adding a series.
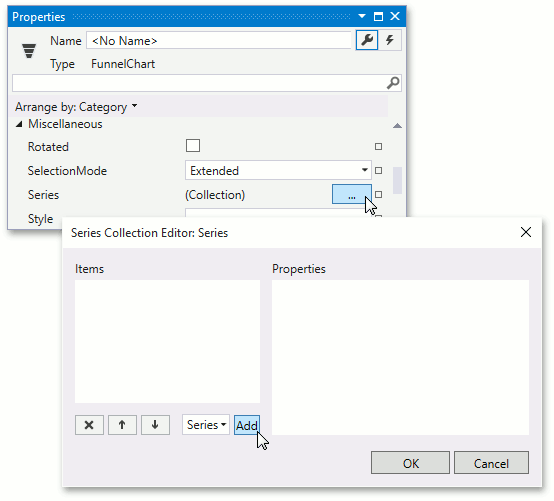
For the FunnelChart control, locate the ChartBase.Series property in the Properties window and click the ellipsis button to invoke the Series Collection Editor: Series dialog. Add one Series object to the collection in this dialog.
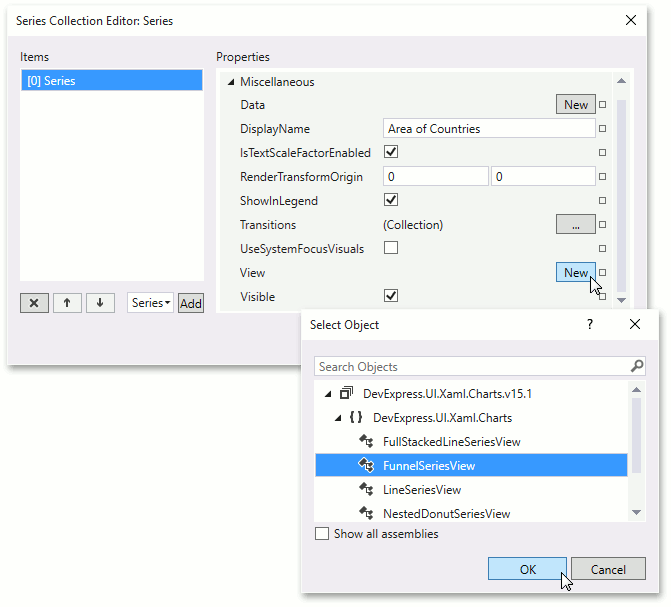
Next, specify a series view for the series by setting the Series.View property to FunnelSeriesView.
To provide data for a series, it is necessary to assign a DataPointCollection to the Series.Data property and fill it with DataPoint objects.
Add data points with following arguments and values to the series.
Argument Value Visited a web site 9152 Download a trial 6870 Contacted to support 5121 Subscribed 2224 Renewed 1670 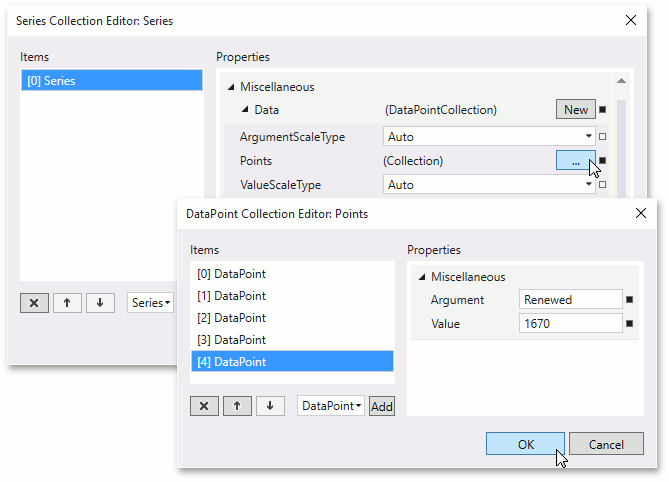
Step 3. Customize the Chart’s Appearance
The chart is almost ready. Now adjust the chart to make it more attractive.
To customize the text shown in the series point’s label, customize the SeriesLabelOptions.Pattern property of an object stored in the SeriesView.LabelOptions property. Set the property to {A}: {VP:P}.

To specify the distance between points of a Funnel series, set the FunnelSeriesView.PointDistance property to 5.
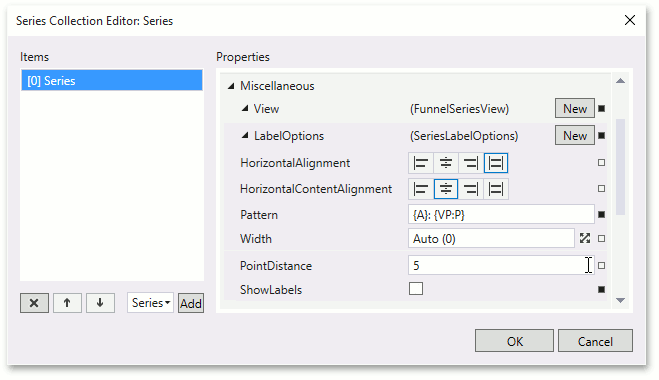
To show labels, set the SeriesView.ShowLabels property to true.

To configure the label position, specify the FunnelSeriesView.LabelPosition attached property. Set the property to FunnelLabelPosition.RightColumn.
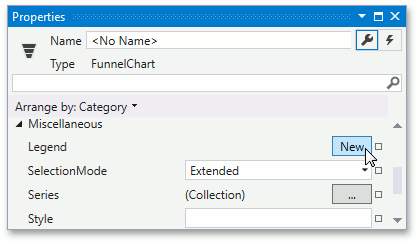
<!-- -->
<Charts:FunnelSeriesView.LabelOptions>
    <Charts:SeriesLabelOptions
        Pattern="{}{A}: {VP:P}"
        Charts:FunnelSeriesView.LabelPosition="Right"/>
</Charts:FunnelSeriesView.LabelOptions>
<!-- -->
The chart does not show a legend by default. If you wish to display one, simply assign the Legend object to the ChartBase.Legend property.
Result
The chart is now ready. Your XAML should appear as follows.
<Page
    xmlns="http://schemas.microsoft.com/winfx/2006/xaml/presentation"
    xmlns:x="http://schemas.microsoft.com/winfx/2006/xaml"
    xmlns:Charts="using:DevExpress.UI.Xaml.Charts"
    x:Class="FunnelChartLesson.MainPage">

    <Grid
        Background="{ThemeResource ApplicationPageBackgroundThemeBrush}">
        <Charts:FunnelChart>
            <Charts:FunnelChart.Palette>
                <Charts:OfficePalette/>
            </Charts:FunnelChart.Palette>
            <Charts:FunnelChart.Series>
                <Charts:Series>
                    <Charts:Series.View>
                        <Charts:FunnelSeriesView
                            PointDistance="5"
                            ShowLabels="True">
                            <Charts:FunnelSeriesView.LabelOptions>
                                <Charts:SeriesLabelOptions
                                    Pattern="{}{A}: {VP:P}"
                                    Charts:FunnelSeriesView.LabelPosition="RightColumn"/>
                            </Charts:FunnelSeriesView.LabelOptions>
                        </Charts:FunnelSeriesView>
                    </Charts:Series.View>
                    <Charts:DataPointCollection>
                        <Charts:DataPoint
                            Argument="Visited a web site"
                            Value="9152"/>
                        <Charts:DataPoint
                            Argument="Downloaded a trial"
                            Value="6870"/>
                        <Charts:DataPoint
                            Argument="Contacted to support"
                            Value="5121"/>
                        <Charts:DataPoint
                            Argument="Subscribed"
                            Value="2224"/>
                        <Charts:DataPoint
                            Argument="Renewed"
                            Value="1670"/>
                    </Charts:DataPointCollection>
                </Charts:Series>
            </Charts:FunnelChart.Series>
        </Charts:FunnelChart>
    </Grid>
</Page>
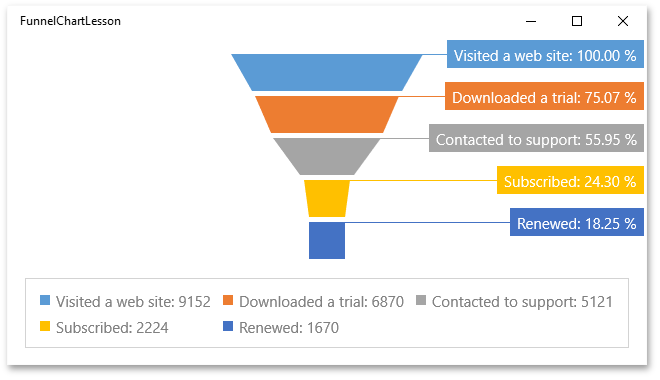
Run the project. The following image illustrates the resulting chart at runtime.
Tip
A complete sample project is available in the DevExpress Code Examples database at http://www.devexpress.com/example=T179113.