Data Points, Series and Series Views
- 2 minutes to read
This document provides general information about the data point. It explains its argument and value(s), and also provides an overview of series and available view types.
Data Points
A chart’s most fundamental element is the data point. A group of data points represents a single series.
No series is displayed until it has at least one data point specified, and points can be specified using the Series.Data property. For more information, refer to Providing Data.
Because charts support numerous series view types, which represent and organize data in different ways, visual representation of a data point differs from one view to another.
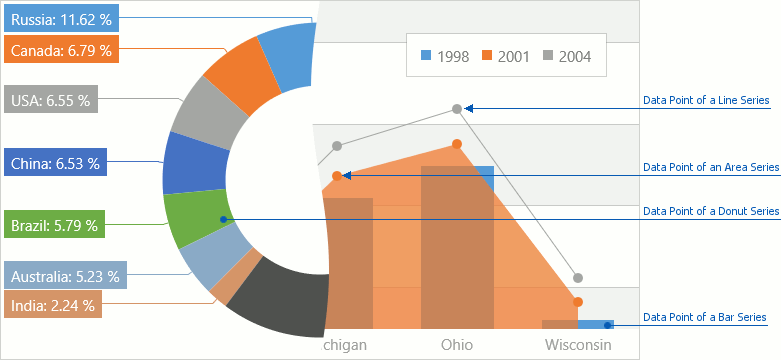
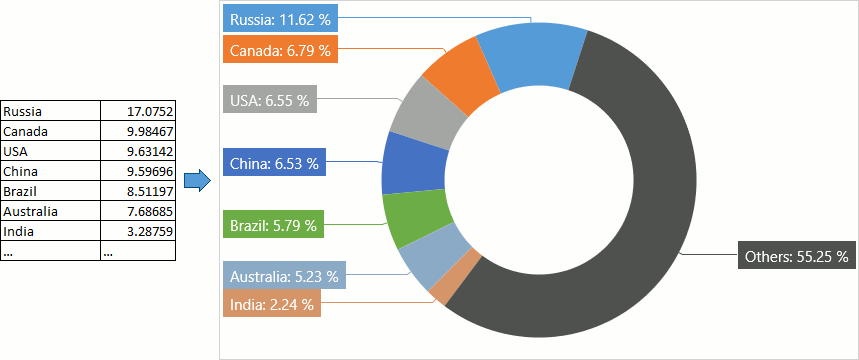
Each data point must have one argument and at least one corresponding value. In general, the pairing of an argument and its value is represented in a diagram’s axes as their X and Y coordinates respectively, or have a slice proportional to the point value part in the series total value, as represented in the following image.
In a chart’s Legend, it is possible to represent either a separate series, or individual points in the series. For details, refer to Legend.
Series and Series Views
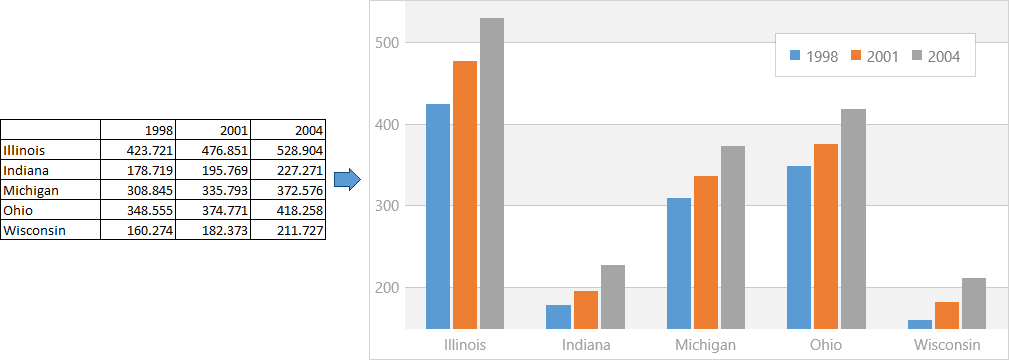
A continuity of data points represents a series, which is not displayed until at least one point is specified. For example, the following image demonstrates three Bar series, and the underlying data they represent.
Series reside in the ChartBase.Series collection. The chart is empty until there is at least one visible series in it. To learn about the ways in which series can be created, refer to Providing Data.
DevExpress Chart Controls for UWP support a number of different chart types. The view type determines both the series’ specific image and the available set of options. For a list of available series view types, refer to Charts Gallery.