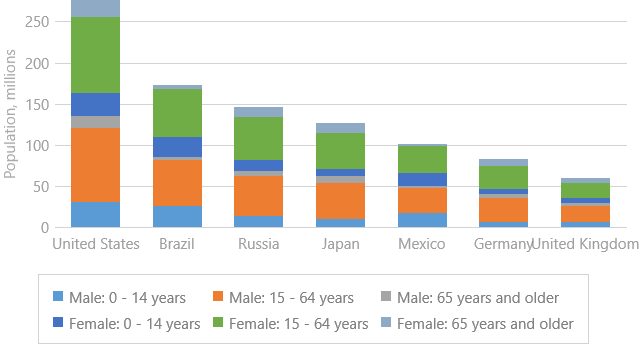
Stacked Bar
The Stacked Bar series displays data as bars on a diagram, so that the value of each data point is aggregated with the underlying data points’ values. This representation is useful when it’s necessary to compare both the point values and their aggregate for the same point arguments.
An example of the Stacked Bar chart is shown in the image below.