ManualNumericScaleOptions.GridSpacing Property
Gets or sets the numeric grid step in grid alignment units.
Namespace: DevExpress.Xpf.Charts
Assembly: DevExpress.Xpf.Charts.v19.1.dll
Declaration
Property Value
| Type | Description |
|---|---|
| Double | A Double value which specifies the numeric grid step. |
Remarks
This feature manages label placement along the axis.
By default, the GridSpacing is set to the default value, so the grid step is calculated automatically. To change the grid step interval for axis labeling, set the ManualNumericScaleOptions.AutoGrid to false, and specify the GridSpacing property value.
The table below shows the GridSpacing property in action for random data.
| ManualNumericScaleOptions.GridSpacing = 1 | ManualNumericScaleOptions.GridSpacing = 2 |
|---|---|
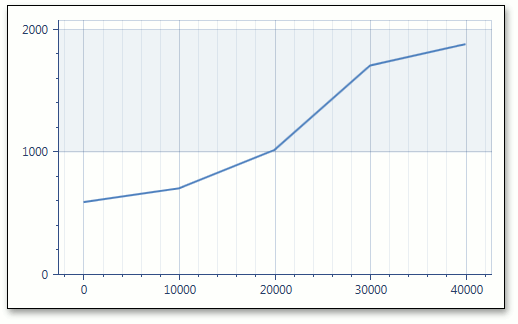 |
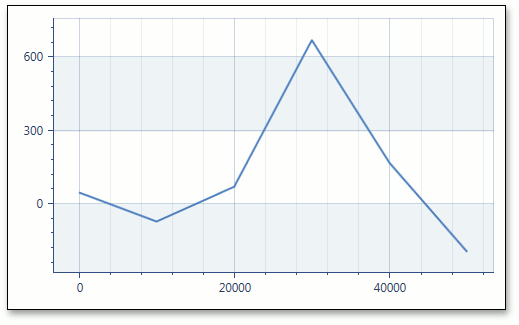 |
Example
This example demonstrates how to use the manual numeric scale options of the X-axis.
When the AxisX2D.NumericScaleOptions property is set to ManualNumericScaleOptions, you can manually define the ManualNumericScaleOptions.GridAlignment, ManualNumericScaleOptions.MeasureUnit and ManualNumericScaleOptions.AggregateFunction properties.
To use the automatic numeric scale options, set the AxisX2D.NumericScaleOptions property to AutomaticNumericScaleOptions and choose the appropriate AutomaticNumericScaleOptions.AggregateFunction.
To prevent the axis scale from being divided into intervals (and thus prevent chart data from being aggregated), set the ManualNumericScaleOptions.AggregateFunction or AutomaticNumericScaleOptions.AggregateFunction property to None.
Note
A complete sample project is available at https://github.com/DevExpress-Examples/how-to-use-manual-numeric-scale-options-of-an-axis-t112243.
<Window
        xmlns="http://schemas.microsoft.com/winfx/2006/xaml/presentation"
        xmlns:x="http://schemas.microsoft.com/winfx/2006/xaml"
        xmlns:dxc="http://schemas.devexpress.com/winfx/2008/xaml/charts"
    x:Class="AggregationNumericData.MainWindow"
        Title="MainWindow" Height="350" Width="525">
    <Grid>
        <dxc:ChartControl >
            <dxc:ChartControl.Legend>
                <dxc:Legend/>
            </dxc:ChartControl.Legend>
            <dxc:XYDiagram2D>
                <dxc:XYDiagram2D.AxisX>
                    <dxc:AxisX2D GridLinesVisible="True">
                        <dxc:AxisX2D.NumericScaleOptions>
                            <dxc:ManualNumericScaleOptions MeasureUnit="100" GridAlignment="1000"
                                                           AggregateFunction="Maximum" GridSpacing="2"/>
                        </dxc:AxisX2D.NumericScaleOptions>
                    </dxc:AxisX2D>
                </dxc:XYDiagram2D.AxisX>
                <dxc:LineSeries2D DataSource="{Binding Path=Series}"
                                  ArgumentDataMember="Argument" ValueDataMember="Value"/>
            </dxc:XYDiagram2D>
        </dxc:ChartControl>
    </Grid>
</Window>
Related GitHub Examples
The following code snippet (auto-collected from DevExpress Examples) contains a reference to the GridSpacing property.
Note
The algorithm used to collect these code examples remains a work in progress. Accordingly, the links and snippets below may produce inaccurate results. If you encounter an issue with code examples below, please use the feedback form on this page to report the issue.