RadarLineScatterSeries2D Class
A 2D scatter radar line series.
Namespace: DevExpress.Xpf.Charts
Assembly: DevExpress.Xpf.Charts.v19.1.dll
Declaration
Remarks
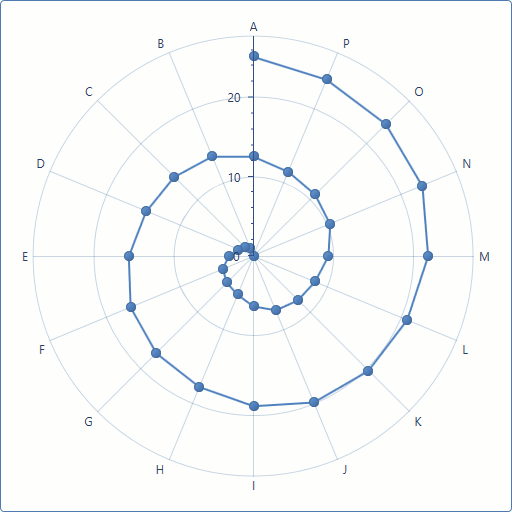
The resulting diagram obtained using the example code should look like the following.
Example
The following example demonstrates how to create a 2D Scatter Radar Line chart.
To do this, it is necessary to assign the ChartControl.Diagram property to RadarDiagram2D, and then add a RadarLineScatterSeries2D object with points to the radar diagram Diagram.Series collection.
Note
A complete sample project is available at https://github.com/DevExpress-Examples/how-to-draw-a-scatter-radar-line-chart-using-a-chart-control-t236165.
<dxc:ChartControl>
    <dxc:RadarDiagram2D>
        <dxc:RadarLineScatterSeries2D>
            <dxc:SeriesPoint Argument="A" Value="0"/>
            <dxc:SeriesPoint Argument="B" Value="1.047197551"/>
            <dxc:SeriesPoint Argument="C" Value="1.570796327"/>
            <dxc:SeriesPoint Argument="D" Value="2.094395102"/>
            <dxc:SeriesPoint Argument="E" Value="3.141592654"/>
            <dxc:SeriesPoint Argument="F" Value="4.188790205"/>
            <dxc:SeriesPoint Argument="G" Value="4.71238898"/>
            <dxc:SeriesPoint Argument="H" Value="5.235987756"/>
            <dxc:SeriesPoint Argument="I" Value="6.283185307"/>
            <dxc:SeriesPoint Argument="J" Value="7.330382858"/>
            <dxc:SeriesPoint Argument="K" Value="7.853981634"/>
            <dxc:SeriesPoint Argument="L" Value="8.37758041"/>
            <dxc:SeriesPoint Argument="M" Value="9.424777961"/>
            <dxc:SeriesPoint Argument="N" Value="10.47197551"/>
            <dxc:SeriesPoint Argument="O" Value="10.99557429"/>
            <dxc:SeriesPoint Argument="P" Value="11.51917306"/>
            <dxc:SeriesPoint Argument="A" Value="12.56637061"/>
            <dxc:SeriesPoint Argument="B" Value="13.61356817"/>
            <dxc:SeriesPoint Argument="C" Value="14.13716694"/>
            <dxc:SeriesPoint Argument="D" Value="14.66076572"/>
            <dxc:SeriesPoint Argument="E" Value="15.70796327"/>
            <dxc:SeriesPoint Argument="F" Value="16.75516082"/>
            <dxc:SeriesPoint Argument="G" Value="17.27875959"/>
            <dxc:SeriesPoint Argument="H" Value="17.80235837"/>
            <dxc:SeriesPoint Argument="I" Value="18.84955592"/>
            <dxc:SeriesPoint Argument="J" Value="19.89675347"/>
            <dxc:SeriesPoint Argument="K" Value="20.42035225"/>
            <dxc:SeriesPoint Argument="L" Value="20.94395102"/>
            <dxc:SeriesPoint Argument="M" Value="21.99114858"/>
            <dxc:SeriesPoint Argument="N" Value="23.03834613"/>
            <dxc:SeriesPoint Argument="O" Value="23.5619449"/>
            <dxc:SeriesPoint Argument="P" Value="24.08554368"/>
            <dxc:SeriesPoint Argument="A" Value="25.13274123"/>
        </dxc:RadarLineScatterSeries2D>
    </dxc:RadarDiagram2D>
</dxc:ChartControl>
Related GitHub Examples
The following code snippet (auto-collected from DevExpress Examples) contains a reference to the RadarLineScatterSeries2D class.
Note
The algorithm used to collect these code examples remains a work in progress. Accordingly, the links and snippets below may produce inaccurate results. If you encounter an issue with code examples below, please use the feedback form on this page to report the issue.