HeatmapRangeColorProvider.ApproximateColors Property
Specifies whether to approximate colors.
Namespace: DevExpress.Xpf.Charts.Heatmap
Assembly: DevExpress.Xpf.Charts.v25.1.dll
NuGet Package: DevExpress.Wpf.Charts
Declaration
Property Value
| Type | Description |
|---|---|
| Boolean | true if an approximation algorithm is applied to colors; otherwise, false. |
Remarks
The ApproximateColors property allows you to apply smooth transition between colors:
| ApproximateColors = true | ApproximateColors = false |
|---|---|
 |
 |
Example
This example shows how to use arrays of string and numeric values to create a heatmap.
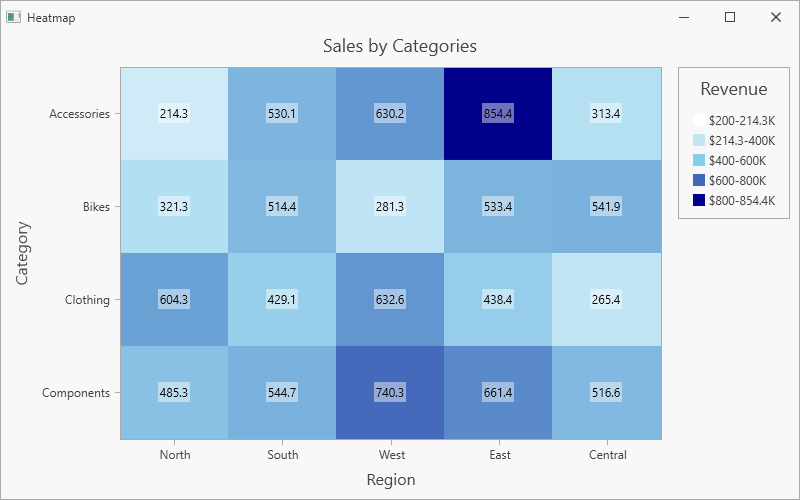
Follow the steps below to create a heatmap:
Add the HeatmapControl to the project.
Create a HeatmapMatrixAdapter object and assign it to the HeatmapControl.DataAdapter property.
Use the adapter’s XArguments and YArguments properties to populate the heatmap with x- and y-arguments that are displayed along x- and y-axes.
Assign a two-dimensional array of double values to the adapter’s Values property.
Create a HeatmapRangeColorProvider object and assign it to the HeatmapControl.ColorProvider property. The Range Color Provider paints cells based on a value range to which the cell value belongs.
Set the HeatmapControl.Legend property to a HeatmapLegend object to display a legend.
Specify the color provider’s HeatmapPaletteColorProvider.LegendItemPattern property to format legend items.
Use the HeatmapControl.AxisX and HeatmapControl.AxisY properties to customize heatmap axes.
To display cell labels, initialize the HeatmapControl.Label property with a HeatmapLabel object.
<dx:ThemedWindow
    xmlns="http://schemas.microsoft.com/winfx/2006/xaml/presentation"
    xmlns:x="http://schemas.microsoft.com/winfx/2006/xaml"
    xmlns:dx="http://schemas.devexpress.com/winfx/2008/xaml/core"
    xmlns:dxh="http://schemas.devexpress.com/winfx/2008/xaml/heatmap"
    xmlns:dxc="http://schemas.devexpress.com/winfx/2008/xaml/charts"
    xmlns:local="clr-namespace:HeatmapMatrixData"
    x:Class="HeatmapMatrixData.MainWindow"
    Title="Heatmap" Height="500" Width="800">
    <Grid>
        <dxh:HeatmapControl>
            <dxh:HeatmapControl.DataContext>
                <local:MatrixHeatmapViewModel/>
            </dxh:HeatmapControl.DataContext>
            <dxh:HeatmapControl.DataAdapter>
                <dxh:HeatmapMatrixAdapter XArguments="{Binding XArguments}"
                                          YArguments="{Binding YArguments}"
                                          Values="{Binding Values}"/>
            </dxh:HeatmapControl.DataAdapter>
            <dxh:HeatmapControl.Titles>
                <dxc:Title Content="Sales by Categories" HorizontalAlignment="Center"/>
            </dxh:HeatmapControl.Titles>
            <dxh:HeatmapControl.ColorProvider>
                <dxh:HeatmapRangeColorProvider ApproximateColors="True"
                                               LegendItemPattern="${V1}-{V2}K">
                    <dxh:HeatmapRangeColorProvider.Palette>
                        <dxc:CustomPalette>
                            <dxc:CustomPalette.Colors>
                                <Color>White</Color>
                                <Color>SkyBlue</Color>
                                <Color>DarkBlue</Color>
                            </dxc:CustomPalette.Colors>
                        </dxc:CustomPalette>
                    </dxh:HeatmapRangeColorProvider.Palette>
                    <dxh:HeatmapRangeColorProvider.RangeStops>
                        <dxh:HeatmapRangeStop Value="0" Type="Percentage"/>
                        <dxh:HeatmapRangeStop Value="200"/>
                        <dxh:HeatmapRangeStop Value="400"/>
                        <dxh:HeatmapRangeStop Value="600"/>
                        <dxh:HeatmapRangeStop Value="800"/>
                        <dxh:HeatmapRangeStop Value="1" Type="Percentage"/>
                    </dxh:HeatmapRangeColorProvider.RangeStops>
                </dxh:HeatmapRangeColorProvider>
            </dxh:HeatmapControl.ColorProvider>
            <dxh:HeatmapControl.Legend>
                <dxh:HeatmapLegend Margin="0, 0, 4, 10">
                    <dxh:HeatmapLegend.Title>
                        <dxc:LegendTitle Content="Revenue"/>
                    </dxh:HeatmapLegend.Title>
                </dxh:HeatmapLegend>
            </dxh:HeatmapControl.Legend>
            <dxh:HeatmapControl.AxisX>
                <dxh:HeatmapAxis>
                    <dxh:HeatmapAxis.Title>
                        <dxc:AxisTitle Content="Region"/>
                    </dxh:HeatmapAxis.Title>
                </dxh:HeatmapAxis>
            </dxh:HeatmapControl.AxisX>
            <dxh:HeatmapControl.AxisY>
                <dxh:HeatmapAxis Reverse="True">
                    <dxh:HeatmapAxis.Title>
                        <dxc:AxisTitle Content="Category"/>
                    </dxh:HeatmapAxis.Title>
                </dxh:HeatmapAxis>
            </dxh:HeatmapControl.AxisY>
            <dxh:HeatmapControl.Label>
                <dxh:HeatmapLabel Foreground="Black"
                                  Background="#70ffffff"
                                  Padding="2"/>
            </dxh:HeatmapControl.Label>
        </dxh:HeatmapControl>
    </Grid>
</dx:ThemedWindow>
using DevExpress.Xpf.Core;

namespace HeatmapMatrixData {
    public partial class MainWindow : ThemedWindow {
        public MainWindow() {
            InitializeComponent();
        }
    }
    public class MatrixHeatmapViewModel {
        public string[] XArguments { get; set; }
        public string[] YArguments { get; set; }
        public double[,] Values { get; set; }
        public MatrixHeatmapViewModel() {
            XArguments = new string[] { "North", "South", "West", "East", "Central" };
            YArguments = new string[] { "Accessories", "Bikes", "Clothing", "Components" };
            Values = new double[,] {
               { 214.3, 530.1, 630.2, 854.4, 313.4 },
               { 321.3, 514.4, 281.3, 533.4, 541.9 },
               { 604.3, 429.1, 632.6, 438.4, 265.4 },
               { 485.3, 544.7, 740.3, 661.4, 516.6 }
            };
        }
    }
}