ChartControlBase.AutoLayout Property
Gets or sets a value which specifies whether the adaptive layout feature is enabled for chart elements in the chart control.
Namespace: DevExpress.Xpf.Charts
Assembly: DevExpress.Xpf.Charts.v19.1.dll
Declaration
Property Value
| Type | Description |
|---|---|
| Boolean | true, to apply the adaptive layout algorithm to the chart; otherwise, false. |
Remarks
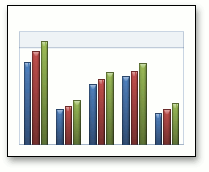
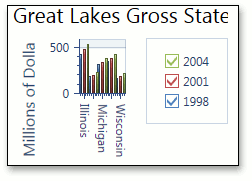
The adaptive layout feature is used to maintain a better chart appearance and layout when the chart becomes smaller.
To accomplish this task, the chart elements that have a Visible property (e.g., a legend, an axis, an axis title, a chart title) are hidden.
In addition, the label position inside bars can be changed for those labels for which the BarSideBySideSeries2D.LabelPosition property is set to Bar2DLabelPosition.Auto mode (the default value).
The following images demonstrate the AutoLayout property in action for BarSideBySideSeries2D.
| AutoLayout =true (the default value) | AutoLayout = false |
|---|---|
 |
 |
In the case of pie and donut charts, the Dimension property for SimpleDiagram2D and SimpleDiagram3D is calculated automatically during resizing. For instance, when you decrease chart size, all pies (donuts) are placed in one line horizontally (by row) or vertically (by column) in the diagram to occupy all the available free space.
Related GitHub Examples
The following code snippets (auto-collected from DevExpress Examples) contain references to the AutoLayout property.
Note
The algorithm used to collect these code examples remains a work in progress. Accordingly, the links and snippets below may produce inaccurate results. If you encounter an issue with code examples below, please use the feedback form on this page to report the issue.