Manage Data Models
- 6 minutes to read
This topic describes how to create and manage data models in the DevExpress Report and Dashboard Server.
Overview
The Report and Dashboard Server separates the document presentation and data layer to allow users to manage data models independently. You should first define a data model that gets access to your data provider (in the read-only mode) and obtains the specified tables and/or views from it. Once you created a data model, you can supply its data to any number of documents (reports and dashboards).
The Report and Dashboard Server supports the following data providers:
- Advantage Database Server
- Amazon Redshift
- Firebird
- Google BigQuery
- IBM DB2
- Microsoft Access 2007
- Microsoft Access 97
- Microsoft SQL Server
- Microsoft SQL Server Compact
- MySQL
- Oracle Database (legacy provider, x86 only)
- Oracle Database (ODP Managed)
- Oracle Database (ODP)
- Pervasive PSQL
- PostgreSQL
- SQL Anywhere
- SQLile
- Sybase ASE
- Teradata
- VistaDB
- VistaDB5
- XML Dataset
Note that the Server does not install any data provider automatically (except Microsoft SQL Server). You should install data providers and register them in GAC.
See How to create a correct connection string for XPO providers for information on how to construct a connection string for each supported provider.
Data Model Security
Consider the following best practices when you create data models in the Report and Dashboard Server:
- We recommend using Windows Authentication when you connect to Microsoft SQL Server.
- Restrict access to the Report and Dashboard Server databases and backups because the Server does not encrypt data models. All information (including connection credentials) is stored as clear text.
Manage Data Models
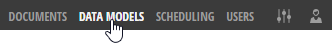
Click the Data Model button on the Report and Dashboard Server’s toolbar to open the data model screen.
This screen is available only if a user has a permission to access and customize data models.
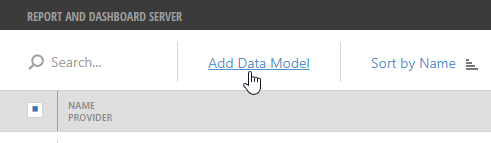
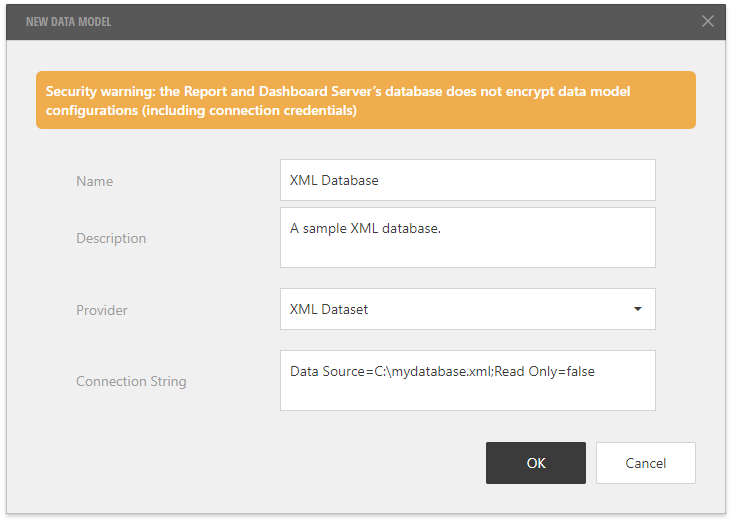
Click the Add Data Model button to create a new data model.
Define the data model’s name and description, select the data provider and specify its connection string. This dialog provides editors to specify connection parameters for the most popular data providers: Microsoft SQL Server, MySQL, Oracle, PostgreSQL, and SyBase ASE.
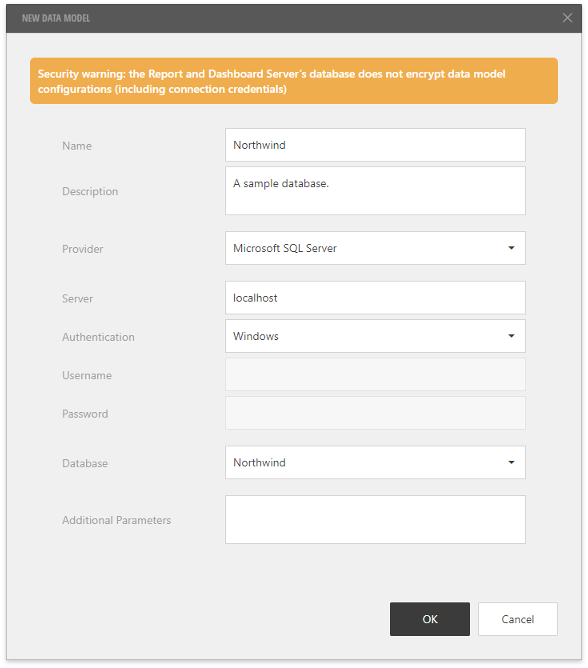
For other providers, you should enter the entire connection string in the Connection String field.
Note that the Report and Dashboard Server backend runs under the Network Service account. If a data model uses Windows authentication to connect to a database, make sure that the Network Service account has permissions to access the database. See the How To: Use the Network Service Account to Access Resources in ASP.NET MSDN topic for information on how to provide privileges to Network Service.
The created data model appears in the list. Select the model to see its details.
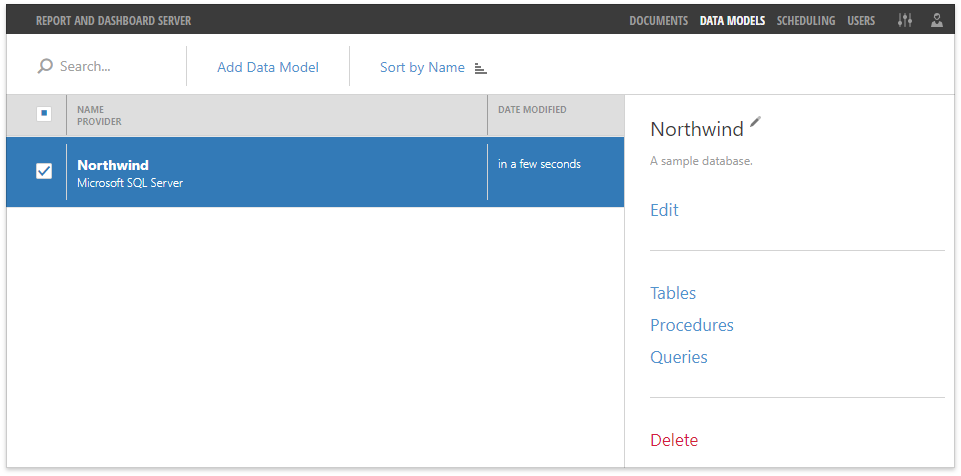
You can use the Edit button to customize the model’s settings.
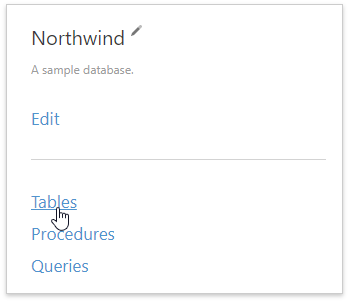
Edit Tables
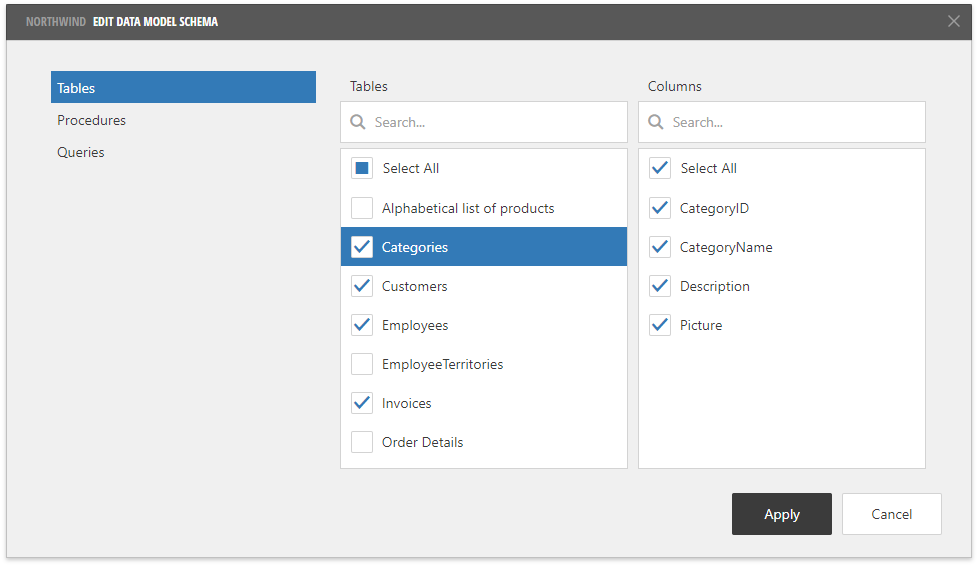
Click the Tables button to open the Edit Data Model Schema dialog’s Tables tab.
Enable checkboxes for tables to include them in the data model. You can also select which columns a table should contain. Search boxes allow you to find a specific table or column.
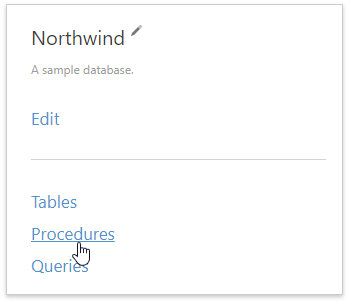
Edit Procedures
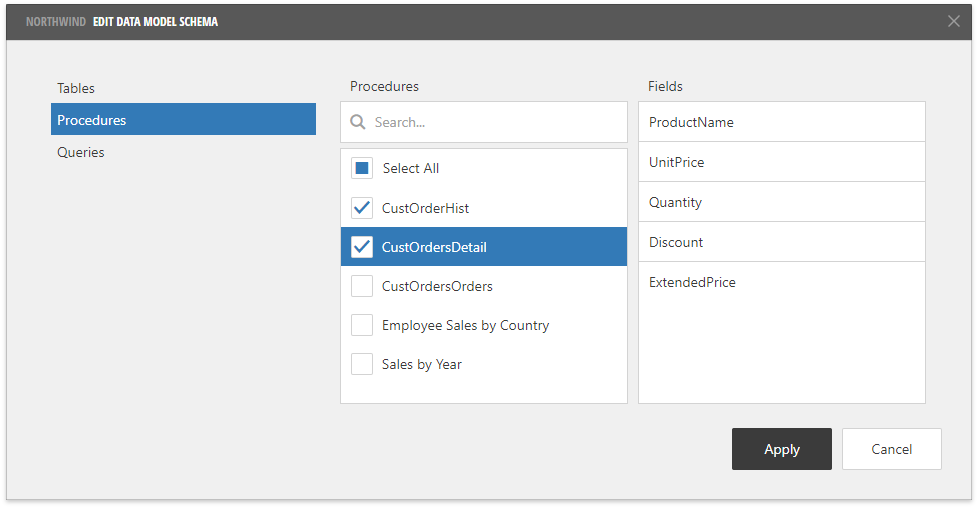
Click the Procedures button to open the Edit Data Model Schema dialog’s Procedures tab.
Enable checkboxes for procedures you want to add to the data model. Select a procedure to see its fields in the Fields list.
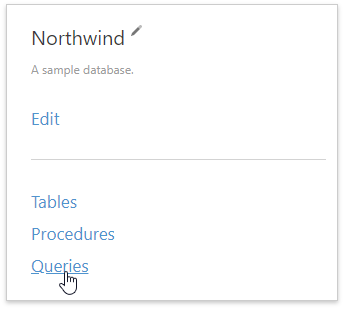
Edit Queries
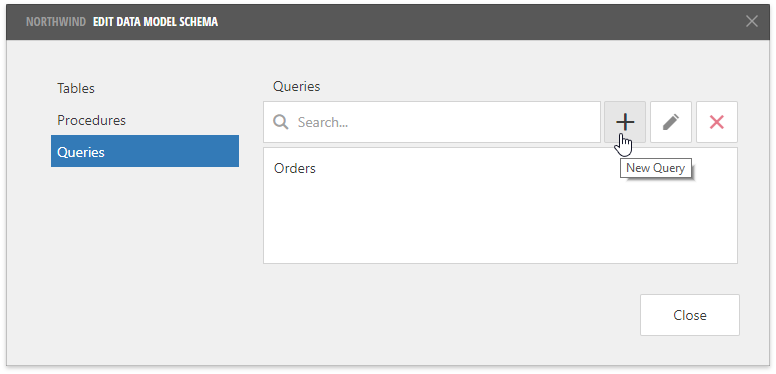
Click the Queries button to open the Edit Data Model Schema dialog’s Queries tab.
Click the New Query button to open the Query Builder and create a new query.
To add a specific table or view to a query, drag the corresponding item from the Available tables and views section and drop it onto the design surface.
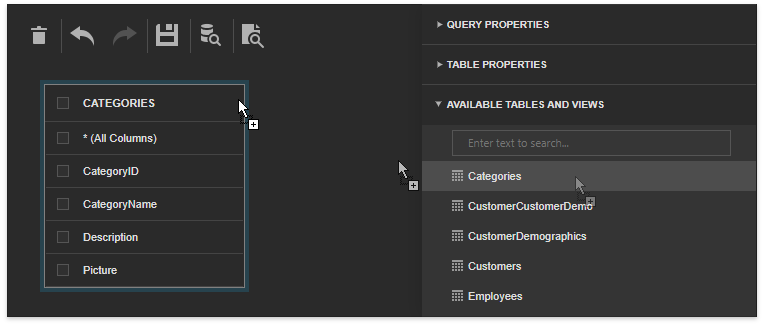
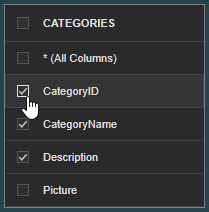
Enable check boxes for the table columns that you want to include in the query result set.
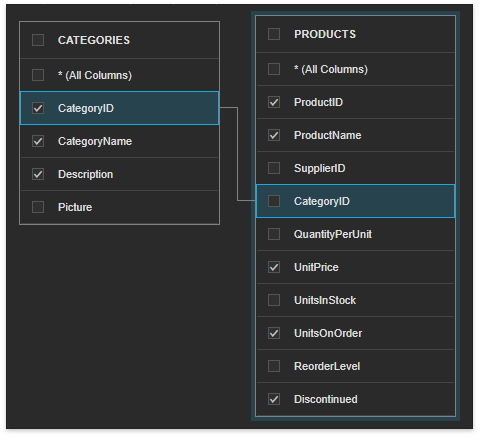
You can join multiple tables within the same query. Drag and drop a subordinate table in the same way you added a main table to include it in a query and automatically create an inner join relation based on a key column.
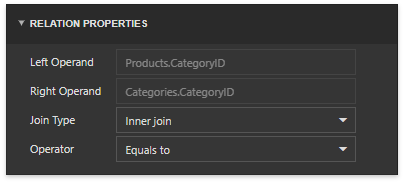
Click the data relation to display its properties in the Relation Properties section. You can define the join type (Inner or Left Outer) and applied logical operator (for instance, Equals to, Is greater than, etc).
Select a table column to access the Column Properties section. These properties allow you to sort column records, group data by this column or apply an aggregate function.
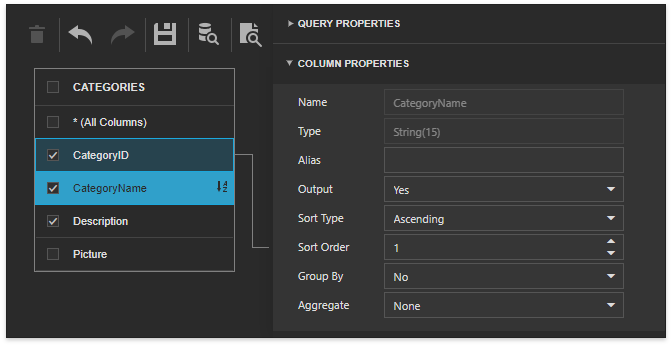
Note
You should apply grouping and/or an aggregate function either to all selected columns or to none of them.
Expand the Query Properties section and specify the query name. Click the Filter property’s ellipsis button to invoke the Filter Editor.
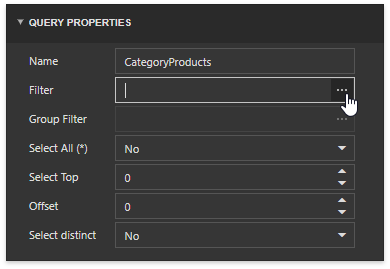
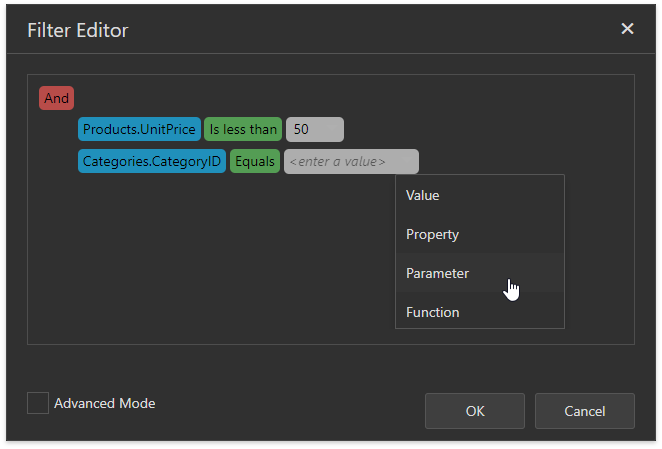
Use the invoked editor to filter data records against static values, other fields’ values, parameters, and/or functions.
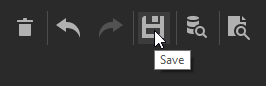
Close the Filter Editor and click the Save toolbar button to save the resulting query.
User-Specific Functions
The Report and Dashboard Server provides the following functions that enable you to access information about the current user:
UserName()
Returns the current user’s name.
UserEmail()
Returns the current user’s email.
IsMemberOf(userGroupName)
Returns true if the current user belongs to a group defined by the userGroupName parameter.
You can use these functions to make a data model return specific data subsets to different users. This restricts access to sensitive information in your database. Users cannot access and modify these functions unless they have the permissions.
However, non-privileged users can use these functions at the document level (to further filter data available to them).
Data Model Level
Apply a user-specific function to a data model query’s filter string to define the users to which the query data is available.
For instance, specify the following filter string to display only orders shipped to a country that corresponds to a user’s group (that is, a user from the USA group should not see orders shipped to other countries):
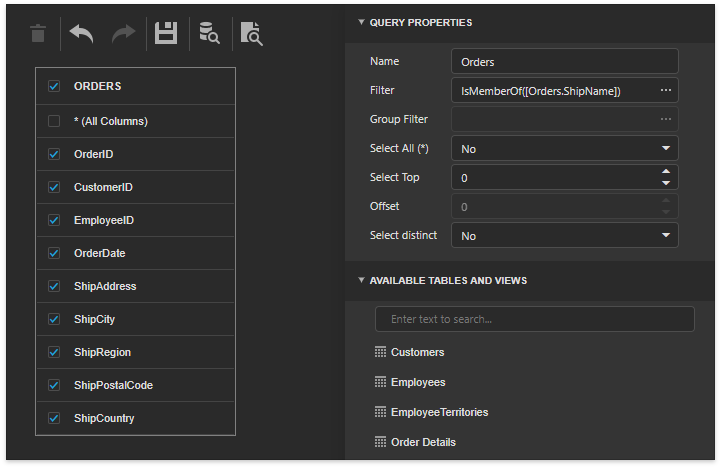
For this function to take an effect, the Report and Dashboard Server should contain user groups for each country listed in the [ShipCountry] data column.
Document Level
Report and Dashboard Server users can apply these functions at the document level.
Do the following to apply a user-specific function to a report‘s query:
Select a query in the Field List and click its Edit Query button.
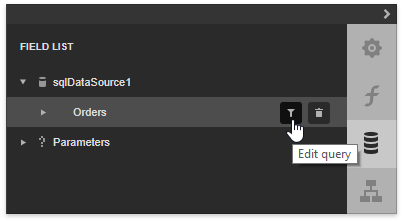
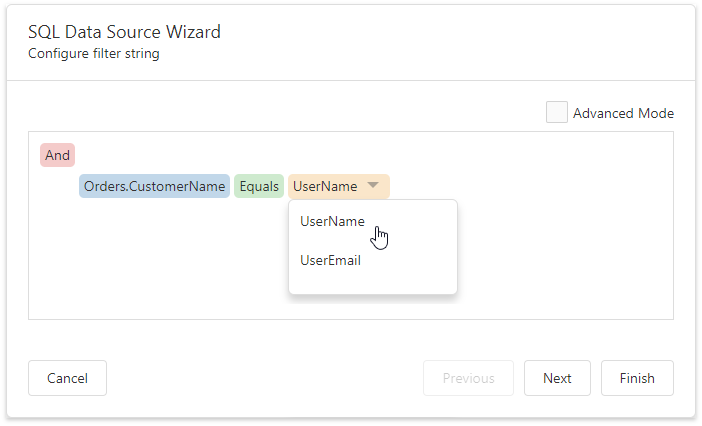
On the invoked wizard page, create a new filter condition and select Function as a value source.
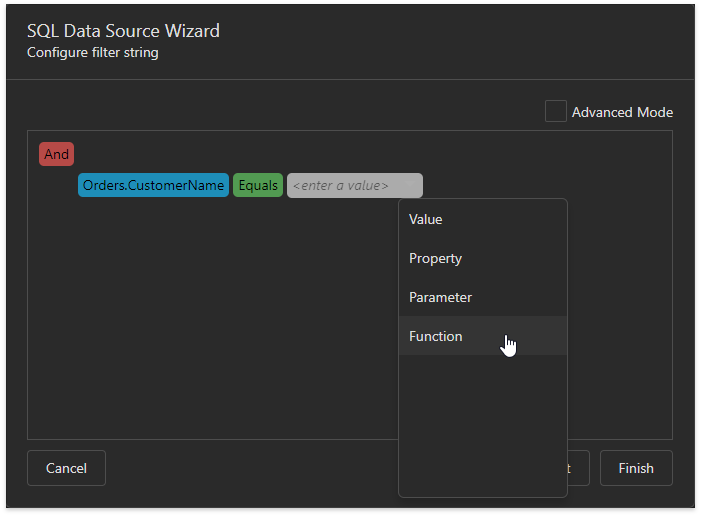
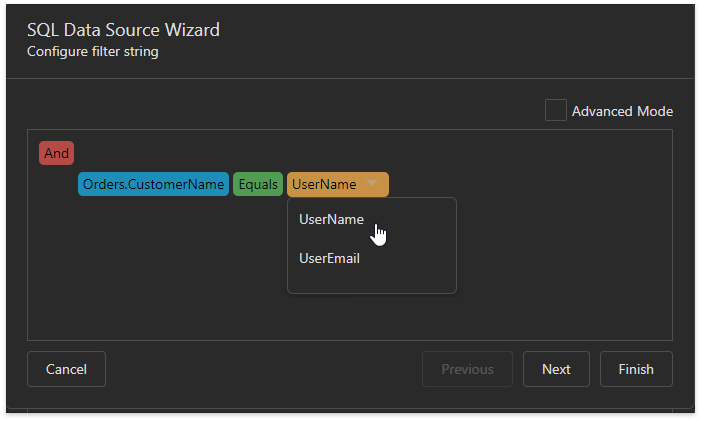
Click the value placeholder and select a user-specific function.
Do the following to apply a user-specific function to a dashboard‘s query:
Open the Data Sources screen, select a query and click its Edit Query button.
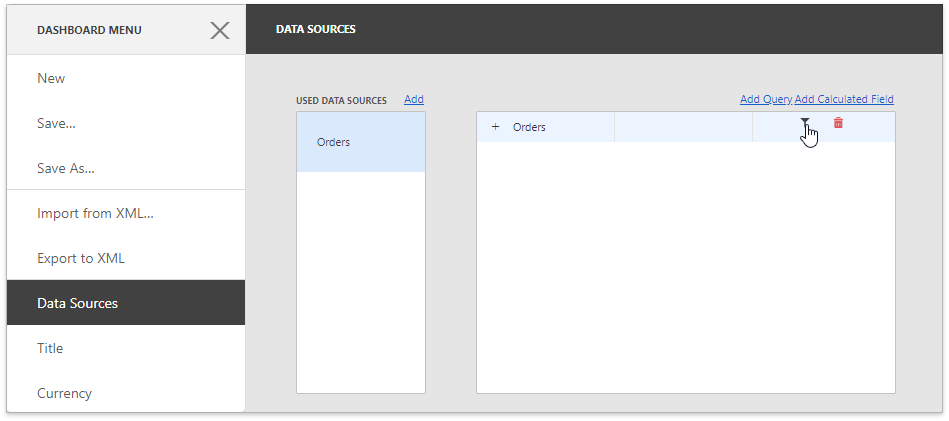
Add a new filter condition and select Function as a value source.
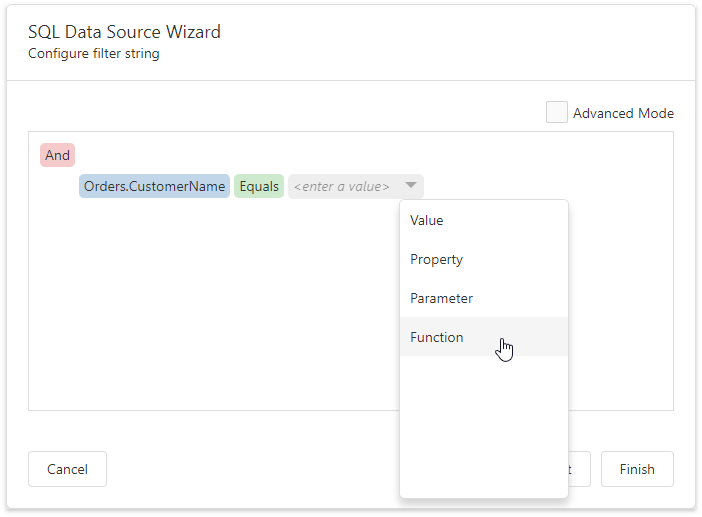
Click the value placeholder and select a user-specific function.