ShapeCollection.InsertChart(DocumentPosition, ChartType) Method
Inserts a chart at the specified position in the document.
Namespace: DevExpress.XtraRichEdit.API.Native
Assembly: DevExpress.RichEdit.v21.2.Core.dll
NuGet Package: DevExpress.RichEdit.Core
Declaration
Parameters
| Name | Type | Description |
|---|---|---|
| pos | DocumentPosition | The position of the chart’s anchor. |
| chartType | ChartType | Specifies the chart type. |
Returns
| Type | Description |
|---|---|
| Shape | The chart embedded in the document. |
Remarks
Enable Charts
Before you create a chart, enable spreadsheet chart support in your word processing app, as described in these topics:
Create a Chart
Use the ShapeCollection.InsertChart method to add a chart to a document. Pass a ChartType enumeration member to this method to specify the chart type.
Use the following properties to populate the chart with data:
- Shape.ChartFormat.Chart
- Cast this property value to DevExpress.Spreadsheet.Charts.ChartObject to obtain a spreadsheet chart associated with the inserted chart object. Use the Spreadsheet Chart API to specify chart settings (select the source data, define series options, and specify the chart layout).
- Shape.ChartFormat.Worksheet
- Cast this property value to a DevExpress.Spreadsheet.Worksheet object to obtain a worksheet that stores chart data.
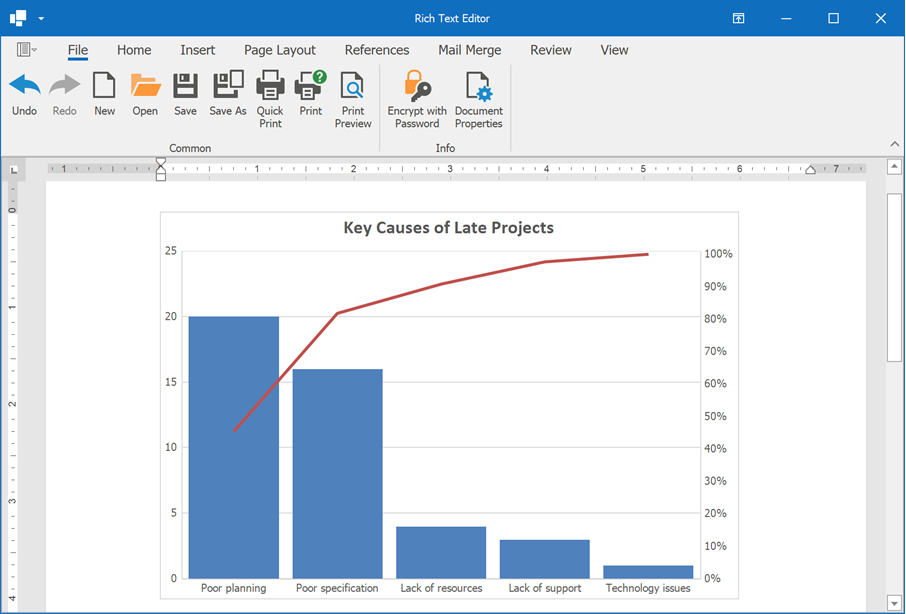
The following code snippet adds a Pareto chart to a document:
using DevExpress.Office.Services;
using DevExpress.XtraSpreadsheet.Services;
using DevExpress.XtraRichEdit.API.Native;
using DevExpress.Spreadsheet.Charts;
using DevExpress.Spreadsheet;
using System.Drawing;
// ...

Document document = wordProcessor.Document;
// Set measurement unit to inches.
document.Unit = DevExpress.Office.DocumentUnit.Inch;
// Create a Pareto chart.
var chartShape = document.Shapes.InsertChart(document.Range.Start,
    DevExpress.XtraRichEdit.API.Native.ChartType.Pareto);
chartShape.Name = "Pareto chart";
// Specify the chart size and position.
chartShape.Size = new System.Drawing.SizeF(6, 4);
chartShape.RelativeHorizontalPosition = ShapeRelativeHorizontalPosition.Column;
chartShape.RelativeVerticalPosition = ShapeRelativeVerticalPosition.Paragraph;
chartShape.Offset = new PointF(0, 0);

// Access the spreadsheet chart object.
ChartObject chart = (ChartObject)chartShape.ChartFormat.Chart;
// Access a worksheet that stores chart data.
Worksheet worksheet = (Worksheet)chartShape.ChartFormat.Worksheet;
// Populate the worksheet with data.
SpecifyChartData(worksheet);
// Select chart data.
chart.SelectData(worksheet["B2:C7"]);

// Specify series options.
var options = chart.Series[0].LayoutOptions.Histogram;
options.BinType = HistogramBinType.ByCategory;
// Specify the gap width.
chart.Series[0].GapWidth = 15;

// Add the chart title.
chart.Title.Visible = true;
chart.Title.SetValue("Key Causes of Late Projects");

private static void SpecifyChartData(Worksheet sheet)
{
    // The first column.
    sheet["B2"].Value = "Key causes of late projects";
    sheet["B3"].Value = "Poor specification";
    sheet["B4"].Value = "Poor planning";
    sheet["B5"].Value = "Lack of support";
    sheet["B6"].Value = "Lack of resources";
    sheet["B7"].Value = "Technology issues";
    // The second column.
    sheet["C2"].Value = "Frequency of occurrences";
    sheet["C3"].Value = 16;
    sheet["C4"].Value = 20;
    sheet["C5"].Value = 3;
    sheet["C6"].Value = 4;
    sheet["C7"].Value = 1;
}
See Also