DataLabelBase.LabelPosition Property
Gets or sets the position of data labels on the chart.
Namespace: DevExpress.Spreadsheet.Charts
Assembly: DevExpress.Spreadsheet.v23.1.Core.dll
NuGet Package: DevExpress.Spreadsheet.Core
Declaration
Property Value
| Type | Description |
|---|---|
| DataLabelPosition | A DataLabelPosition enumeration value specifying the data label placement. |
Example
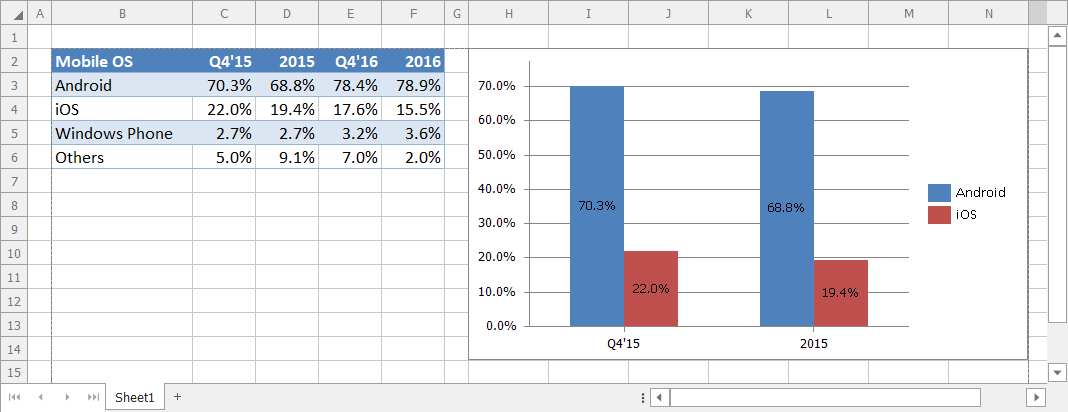
The example below demonstrates how to create a clustered column chart, enable data labels, and specify their location using the DataLabelBase.LabelPosition property. This example centers data labels within columns.
Worksheet worksheet = workbook.Worksheets["chartTask3"];
workbook.Worksheets.ActiveWorksheet = worksheet;

// Create a chart and specify its location.
Chart chart = worksheet.Charts.Add(ChartType.ColumnClustered, worksheet["B2:D4"]);
chart.TopLeftCell = worksheet.Cells["H2"];
chart.BottomRightCell = worksheet.Cells["N14"];

// Display data labels and specify their position within the chart.
chart.Views[0].DataLabels.ShowValue = true;
chart.Views[0].DataLabels.LabelPosition = DataLabelPosition.Center;
Related GitHub Examples
The following code snippets (auto-collected from DevExpress Examples) contain references to the LabelPosition property.
Note
The algorithm used to collect these code examples remains a work in progress. Accordingly, the links and snippets below may produce inaccurate results. If you encounter an issue with code examples below, please use the feedback form on this page to report the issue.