Trend Indicators
- 6 minutes to read
The Dashboard Designer allows you to display predefined trend indicators in Chart dashboard items. You can also create and register custom indicators.
Trend indicators are statistical tools used to analyze data and identify patterns or relationships between variables.
The following indicator types are available:
- Trend Line
- Displays the general direction of associated points. It is often used to identify existing data trends and can help forecast future trends.
- Regression Line
- Visualizes data using a mathematical formula that minimizes the distance between the line itself and associated data points. It is used to model the relationship between two variables and can be used to make predictions about one variable based on the value of another.
- Custom Indicator
- Allows you to implement your own custom indicator type.
Create a Trend Indicator in the UI
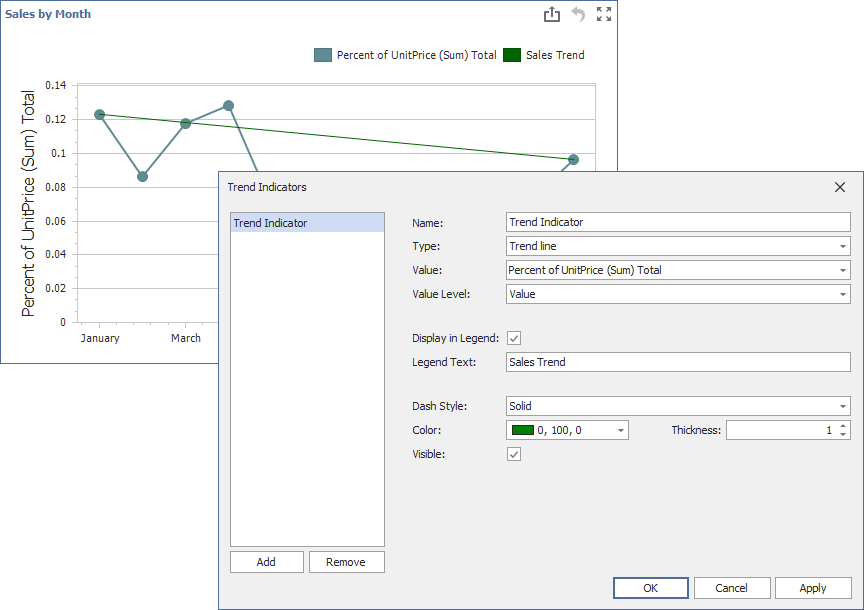
Click the Trend Indicators button in the Analysis group of the Data Ribbon page. This command invokes the Trend Indicators dialog:
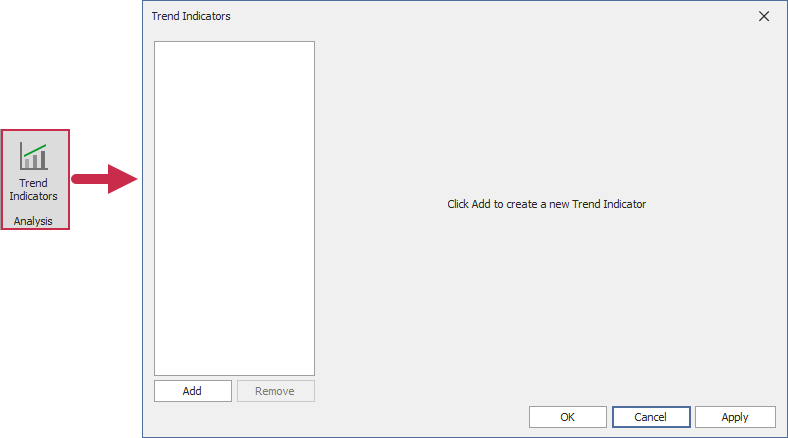
The dialog contains the following buttons:
- Add
- Creates a new indicator.
- Remove
- Removes the selected indicator.
- OK
- Saves changes and closes the dialog.
- Apply
- Saves changes and keeps the dialog open.
- Cancel
- Closes the dialog and discards unsaved changes.
New indicators are generated with default settings:
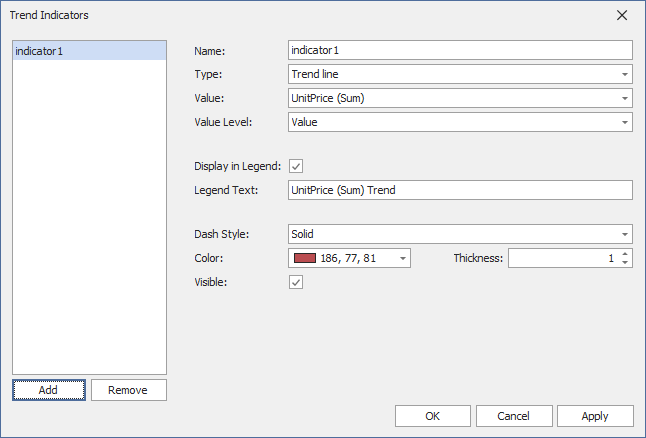
You can change the following settings before displaying an indicator in a Chart dashboard item.
- Name
- The name of the trend indicator within the indicators collection.
- Type
- The indicator type: Trend Line, Regression Line, or a Custom Type.
- Value
- The measure data item that is used to calculate the trend indicator.
- Value Level
- The value that specifies which series point value should be used to calculate the indicator.
- Display In Legend
- Specifies whether to display the trend indicator in the legend.
- Legend Text
- The text that identifies the trend indicator within the legend.
- Dash Style
- The dash style used to paint the line.
- Thickness
- The thickness of the indicator line.
- Color
- The color for the trend indicator.
- Visible
- Specifies whether to display the trend indicator.
Create a Trend Indicator in Code
You can create a trend indicator in code as follows:
Create a ChartRegressionLine or ChartTrendLine object and specify its settings.
Add the created object to the ChartDashboardItem.Indicators collection to display the configured indicator in the UI.
The following example shows how to create a trend line at runtime:
using System.Drawing;
using System.Linq;
using System.Windows.Forms;
using DevExpress.DashboardCommon;

namespace WinForm {
    public partial class FormDesigner : Form {
        public FormDesigner() {
            InitializeComponent();
            var dashboard = new Dashboard1();
            ChartDashboardItem chartItem = dashboard.Items.First(x => x.ComponentName == "chartDashboardItem1") as ChartDashboardItem;
            ChartTrendLine trendline = new ChartTrendLine();
            SimpleSeries simpleSeries = chartItem.Panes[0].Series[0] as SimpleSeries;
            if (simpleSeries != null) {
                trendLine.Value = simpleSeries.Value.UniqueId;
            }
            trendline.Name = "Trend Indicator";
            trendline.ValueLevel = DevExpress.XtraCharts.ValueLevel.Value;
            trendline.LegendText = "Sales Trend";
            trendline.ShowInLegend = true;
            trendline.Color = Color.DarkGreen;

            chartItem.Indicators.Add(trendline);
            dashboardDesigner.Dashboard = dashboard;
            dashboardDesigner.CreateRibbon();
            dashboardDesigner.CreateCustomItemBars();
        }
    }
}
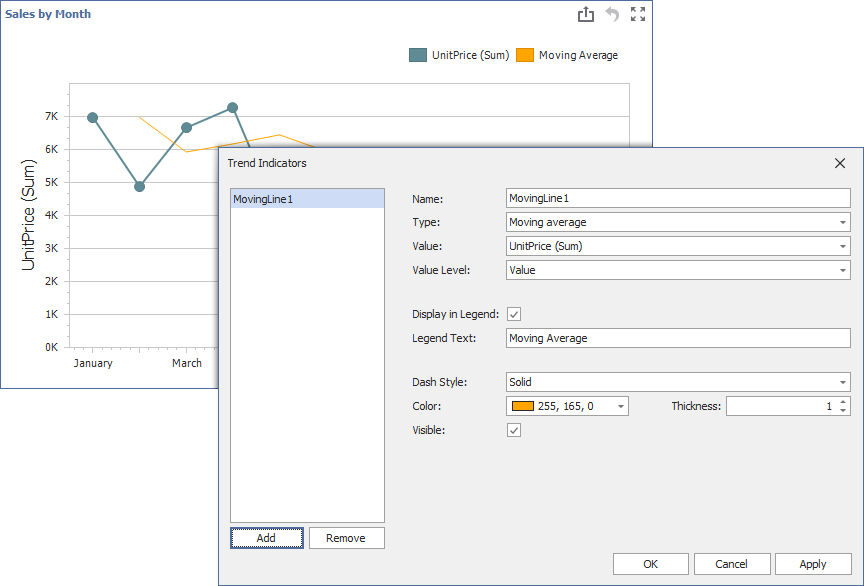
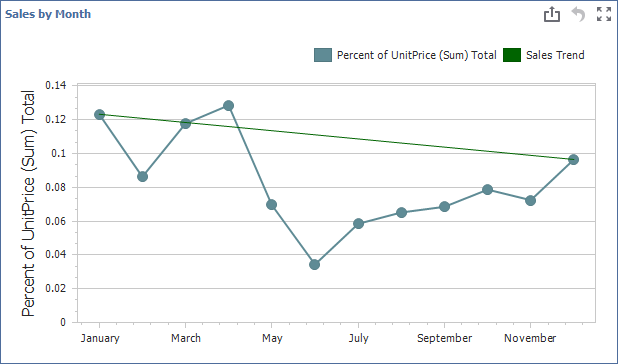
You can also edit the newly created indicator in the Trend Indicators dialog:
Create a Custom Trend Indicator
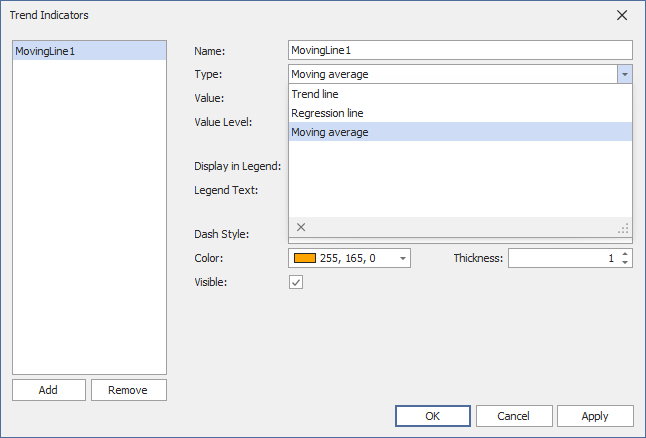
Follow the instructions below to create a custom “Moving Average” indicator:
Create a Custom Indicator Type
Create a ChartCustomIndicator descendant (the MovingIndicator class in this example). MovingIndicator accepts a collection of data points, evaluates the values, and returns the resulting points. These points are used to draw the indicator.
Register the Custom Indicator Type
Register the MovingIndicator type in IndicatorFactory to make this type available as the indicator type in the Trend Indicators editor.
Call the Register method in your application before you save and load a dashboard to serialize and deserialize the indicator within the dashboard XML.
Configure and Display the Indicator
Create an instance of MovingIndicator and specify indicator settings.
This property is required to display the indicator in the Chart dashboard item when you launch the application:
- Value
- Specifies the measure data item that is used to calculate the trend indicator.
If you do not specify the following properties, their default values are used:
- Name
- Specifies the name of the trend indicator within the indicators collection.
- ValueLevel
- Gets or sets the value that specifies which series point value should be used to calculate the indicator.
- ShowInLegend
- Specifies whether to display the trend indicator in the legend.
- LegendText
- Specifies the text that identifies the trend indicator within the legend.
- Thickness
- Specifies the thickness of the indicator line.
- Color
- Specifies the trend indicator’s color.
- DashStyle
- Specifies the dash style used to paint the line.
- Visible
- Specifies whether to display the trend indicator.
Add MovingIndicator to the chart indicators collection to display the configured indicator in the UI.
The following code snippet illustrates the steps above:
using System;
using System.Collections.Generic;
using System.Drawing;
using System.Linq;
using System.Windows.Forms;
using DevExpress.DashboardCommon;
using DevExpress.DashboardCommon.ViewerData;

namespace WinForm {
    public partial class FormDesigner : Form {
        public FormDesigner() {
            try {
                IndicatorFactory.Register<MovingIndicator>("Moving average");
            } catch(Exception e) {
                MessageBox.Show(e.Message);
            }
            InitializeComponent();
            var dashboard = new Dashboard1();
            ChartDashboardItem chartItem = dashboard.Items.First(x => x.ComponentName == "chartDashboardItem1") as ChartDashboardItem;
            MovingIndicator trendLine = new MovingIndicator() {
                Name = "MovingLine1",
                Value = "DataItem1",
                ValueLevel = DevExpress.XtraCharts.ValueLevel.Value,
                Color = Color.Orange,
                LegendText = "Moving Average"
            };
            chartItem.Indicators.Add(trendLine);
            dashboardDesigner.Dashboard = dashboard;
            dashboardDesigner.CreateRibbon();
            dashboardDesigner.CreateCustomItemBars();
        }
    }

    public class MovingIndicator : ChartCustomIndicator {
        protected override Dictionary<AxisPoint, object> Calculate(Dictionary<AxisPoint, decimal?> values) {
            var items = new Dictionary<AxisPoint, object>(values.Count);

            var sum = decimal.Zero;
            var count = 0;
            foreach(KeyValuePair<AxisPoint, decimal?> point in values) {
                if(count == 0) {
                    items.Add(point.Key, null);
                } else {
                    items.Add(point.Key, sum / count);
                }
                sum += point.Value ?? 0;
                count++;
            }

            return items;
        }
    }
}
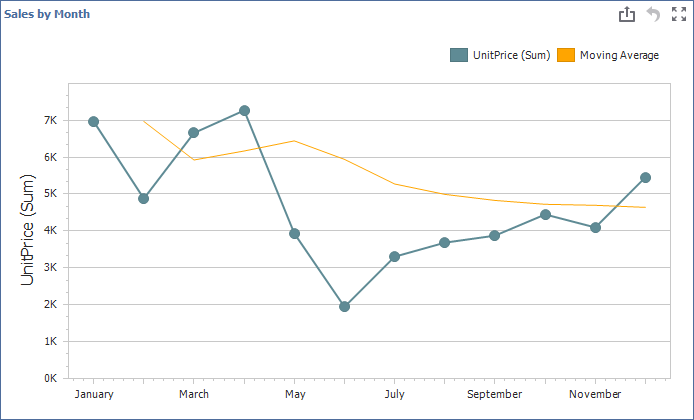
The following image illustrates the result: