ChartIndicatorBase.Value Property
Specifies the measure data item that is used to calculate the trend indicator.
Namespace: DevExpress.DashboardCommon
Assembly: DevExpress.Dashboard.v23.1.Core.dll
NuGet Packages: DevExpress.Dashboard.Core, DevExpress.Win.Dashboard.Design
Declaration
Property Value
| Type | Default | Description |
|---|---|---|
| String | null | A data item’s ID that specifies the measure used to calculate the trend indicator. |
Remarks
Use the DataItem.UniqueId property to get the data item’s ID.
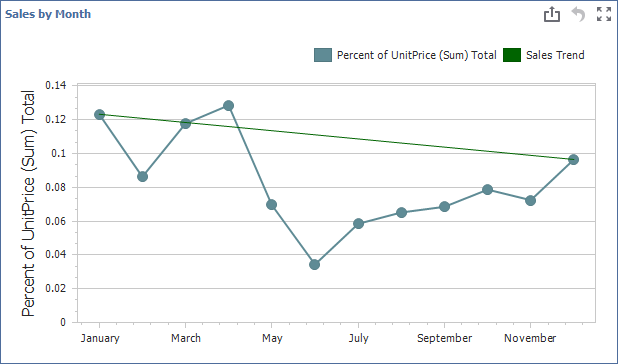
The following example shows how to create a trend line at runtime:
using System.Drawing;
using System.Linq;
using System.Windows.Forms;
using DevExpress.DashboardCommon;

namespace WinForm {
    public partial class FormDesigner : Form {
        public FormDesigner() {
            InitializeComponent();
            var dashboard = new Dashboard1();
            ChartDashboardItem chartItem = dashboard.Items.First(x => x.ComponentName == "chartDashboardItem1") as ChartDashboardItem;
            ChartTrendLine trendline = new ChartTrendLine();
            SimpleSeries simpleSeries = chartItem.Panes[0].Series[0] as SimpleSeries;
            if (simpleSeries != null) {
                trendLine.Value = simpleSeries.Value.UniqueId;
            }
            trendline.Name = "Trend Indicator";
            trendline.ValueLevel = DevExpress.XtraCharts.ValueLevel.Value;
            trendline.LegendText = "Sales Trend";
            trendline.ShowInLegend = true;
            trendline.Color = Color.DarkGreen;

            chartItem.Indicators.Add(trendline);
            dashboardDesigner.Dashboard = dashboard;
            dashboardDesigner.CreateRibbon();
            dashboardDesigner.CreateCustomItemBars();
        }
    }
}
See Also