How to: Use Dashboard Items in Tab Pages as Independent Master Filters
This example demonstrates how to implement a custom visual interactivity that enables the Grid dashboard items placed in different tab pages to act as independent master filters.
The example uses the following API:
The DashboardDesigner.DashboardItemSelectionChanged event is handled to assign selected values to a dashboard’s parameter and save them in a variable.
The DashboardDesigner.DashboardItemVisualInteractivity event is handled to restore the selected values and highlight a grid row.
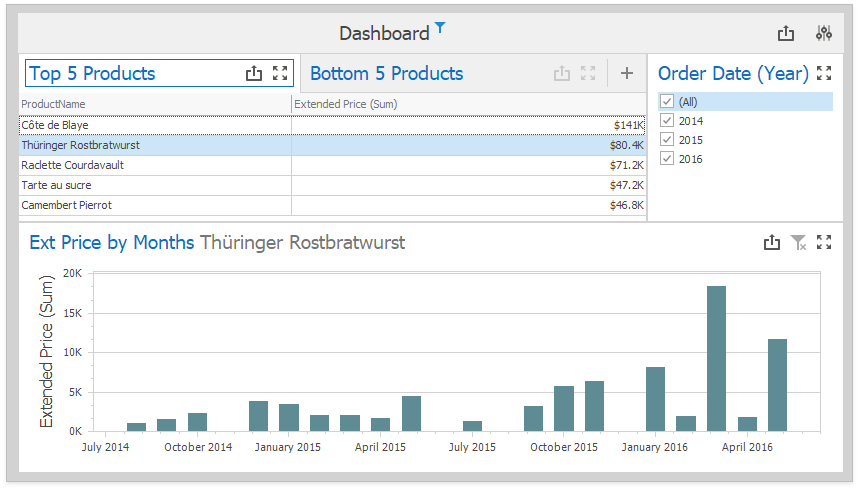
The DashboardDesigner.CustomizeDashboardItemCaption event displays the filter value in the Chart item’s caption.
The DashboardDesigner.ConfigureDataConnection event specifies the Extract Data Source file location at runtime.