Providing Data
- 5 minutes to read
The Dashboard Designer allows you to bind various dashboard items to data in a virtually uniform manner. To learn more, see the Binding Dashboard Items to Data topic.
The only difference is in the data sections that the required dashboard item has. This topic describes how to bind a Choropleth Map dashboard item to data in the Designer or in code.
Binding to Data in the Designer
The image below shows a sample Choropleth Map dashboard item that is bound to data.
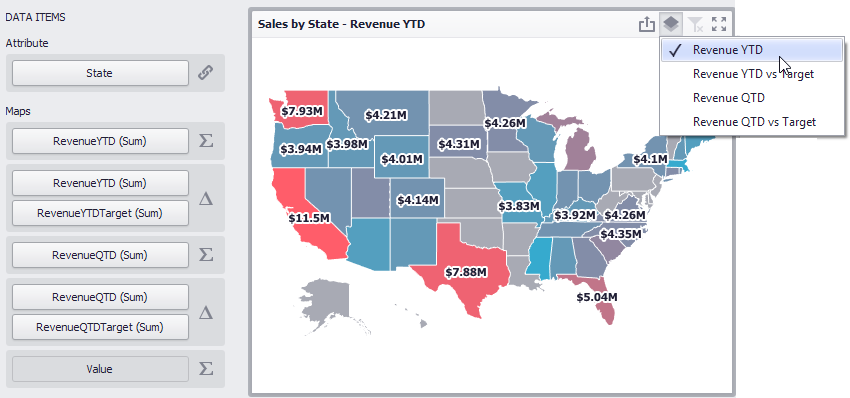
To bind the Choropleth Map dashboard item to data, drag and drop a data source field to a placeholder contained in one of the available data sections. The Choropleth Map provides two data item groups for data binding: DATA ITEMS and TOOLTIP DATA ITEMS. Tables below list the available data sections.
DATA ITEMS
Section | Processed as | Description |
|---|---|---|
Attribute | Allows you to associate map shapes with data source field values. To associate map shapes with data source field values, drag-and-drop the required dimension to the data item’s placeholder and select the required attribute in the Map Attribute Binding dialog. To invoke this dialog, click the Options button (the
Select the required attribute and click OK. | |
Maps | Contains data items whose values are used to color map shapes. Map shape colors vary based on the map type. Click the Options button (the
Note You can fill several data item containers in the Maps section and use the Values drop-down menu to switch between the provided values. To invoke the Values menu, click the |
 icon) next to the Attribute placeholder.
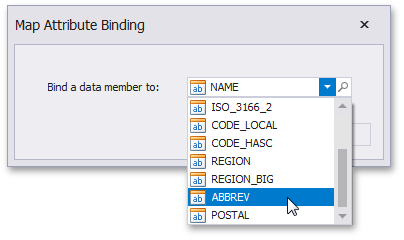
 or
or  icon depending on the map type) next to the Value placeholder and select the required map type in the invoked Choropleth Map Options dialog.
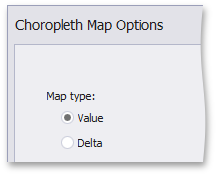
 icon in the dashboard item caption.
TOOLTIP DATA ITEMS
Section | Processed as | Description |
|---|---|---|
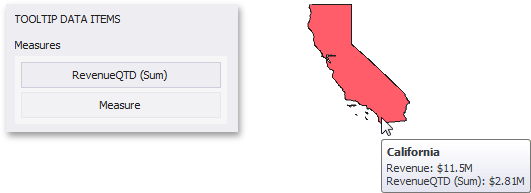
Measures | Allows you to add supplementary content to the tooltips. Drag and drop the required measures to provide additional data.
|
Binding to Data in Code
To provide data for the Choropleth Map dashboard item, do the following.
- Provide the required map. Use the MapDashboardItem.Area property to specify the built-in map or specify the existing shapefile using the MapDashboardItem.CustomShapefile property.
- Specify the binding between the required map attribute and the data source field. Use the ChoroplethMapDashboardItem.AttributeName property to specify the name of the required attribute. Specify the corresponding dimension using the ChoroplethMapDashboardItem.AttributeDimension property.
Specify the measure or set of measures that will be used to color map shapes.
- To color map shapes depending on the provided measure, pass the required measure to the ValueMap constructor and add the ValueMap object to the ChoroplethMapDashboardItem.Maps collection.
- To indicate the difference between the actual and target values of a particular parameter, pass the required measures to the DeltaMap constructor, and add the DeltaMap object to the ChoroplethMapDashboardItem.Maps collection.
- Optionally, provide tooltip values using the MapDashboardItem.TooltipMeasures property.
Example
The following example demonstrates how to bind a Choropleth Map dashboard item to data in code.
Note
A complete sample project is available at https://github.com/DevExpress-Examples/how-to-bind-a-choropleth-map-dashboard-item-to-data-in-code-e5010.
Imports System.Windows.Forms
Imports DevExpress.DashboardCommon
Imports DevExpress.DataAccess.ConnectionParameters
Imports DevExpress.DataAccess.Sql

Namespace Dashboard_CreateChoroplethMap
    Partial Public Class Form1
        Inherits Form

        Public Sub New()
            InitializeComponent()

            ' Creates a new dashboard and a data source for this dashboard.
            Dim dashboard As New Dashboard()

            Dim dataSource As New DashboardSqlDataSource()
            Dim sqlQuery As New CustomSqlQuery("Countries", "select * from Countries")
            dataSource.ConnectionParameters = New Access97ConnectionParameters("..\..\Data\countriesDB.mdb", "", "")
            dataSource.Queries.Add(sqlQuery)

            ' Creates a choropleth map dashboard item and specifies its data source.
            Dim choroplethMap As New ChoroplethMapDashboardItem()
            choroplethMap.DataSource = dataSource
            choroplethMap.DataMember = "Countries"

            ' Loads the map of the world.
            choroplethMap.Area = ShapefileArea.WorldCountries

            ' Specifies a binding between the required map attribute and the data source field.
            choroplethMap.AttributeName = "NAME"
            choroplethMap.AttributeDimension = New Dimension("Country")

            ' Creates a ValueMap object with a measure that provides data for color map shapes.
            ' Then, adds this object to the Maps collection of the choropleth map dashboard item.
            Dim populationMap As New ValueMap(New Measure("Population"))
            choroplethMap.Maps.Add(populationMap)

            ' Adds the choropleth map dashboard item to the dashboard and opens this
            ' dashboard in the Dashboard Viewer.
            dashboard.Items.Add(choroplethMap)
            dashboardViewer1.Dashboard = dashboard
        End Sub
    End Class
End Namespace