Providing Data
- 5 minutes to read
The Dashboard Designer allows you to bind various dashboard items to data in a virtually uniform manner. To learn more, see the Binding Dashboard Items to Data topic.
The only difference is in the data sections that the required dashboard item has. This topic describes how to bind a Range Filter dashboard item to data in the Designer or in code.
Note
The Range Filter dashboard item cannot be bound to the OLAP data source.
Binding to Data in the Designer
The image below shows a sample Range Filter dashboard item that is bound to data.
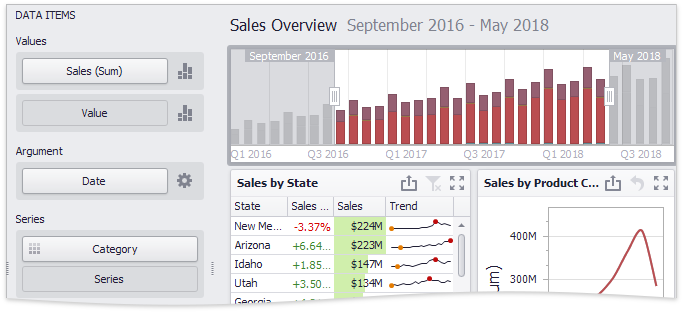
To bind the Range Filter dashboard item to data, drag and drop a data source field to a placeholder contained in one of the available data sections. A table below lists and describes Range Filter data sections.
Section | Processed as | Description |
|---|---|---|
Values | Contains data items against which the Y-coordinates of data points are calculated. | |
Argument | Contains a data item that provides values displayed along the horizontal axis of the Range Filter. Filtering is performed based on these values. Note Note that the Options button (the | |
Series | Contains data items whose values are used to create chart series. |
 icon) allows you to create
 Binding to Data in Code
To provide data for the Range Filter dashboard item, use the following properties.
Argument | |
Series | |
Values | To provide values that determine the Y-coordinate of data points, do the following.
|
Example
The following example demonstrates how to bind a Range Filter dashboard item to data in code.
In this example, the Range Filter is used to apply filtering to a pivot dashboard item’s data.
Note
A complete sample project is available at https://github.com/DevExpress-Examples/how-to-bind-a-range-filter-dashboard-item-to-data-in-code-e4773.
Imports System
Imports System.Windows.Forms
Imports DevExpress.DashboardCommon
Imports DevExpress.DataAccess

Namespace Dashboard_CreateRangeFilter
    Partial Public Class Form1
        Inherits Form

        Public Sub New()
            InitializeComponent()
        End Sub
        Private Function CreateRangeFilter(ByVal dataSource As DashboardObjectDataSource) _
            As RangeFilterDashboardItem

            ' Creates a Range Filter dashboard item and specifies its data source.
            Dim rangeFilter As New RangeFilterDashboardItem()
            rangeFilter.DataSource = dataSource

            ' Creates a new series of the Area type and adds this series to the Series collection to
            ' display it within the Range Filter.
            Dim salesAmountSeries As New SimpleSeries(SimpleSeriesType.Area)
            rangeFilter.Series.Add(salesAmountSeries)

            ' Specifies a measure to provide data used to calculate the Y-coordinate of the data points.
            salesAmountSeries.Value = New Measure("Extended Price")

            ' Specifies a dimension to provide Range Filter argument values.
            rangeFilter.Argument = New Dimension("OrderDate")

            ' Specifies a group interval for argument values.
            rangeFilter.Argument.DateTimeGroupInterval = DateTimeGroupInterval.MonthYear

            Return rangeFilter
        End Function
        Private Sub Form1_Load(ByVal sender As Object, ByVal e As EventArgs) Handles MyBase.Load

            ' Creates a dashboard and sets it as the currently opened dashboard in the dashboard viewer.
            dashboardViewer1.Dashboard = New Dashboard()

            ' Creates a data source and adds it to the dashboard data source collection.
            Dim dataSource As New DashboardObjectDataSource()
            dataSource.DataSource = (New nwindDataSetTableAdapters.SalesPersonTableAdapter()).GetData()
            dashboardViewer1.Dashboard.DataSources.Add(dataSource)

            ' Creates a Range Filter dashboard item with the specified data source
            ' and adds it to the Items collection to display within the dashboard.
            Dim rangeFilter As RangeFilterDashboardItem = CreateRangeFilter(dataSource)
            dashboardViewer1.Dashboard.Items.Add(rangeFilter)

            ' Creates a pivot and adds it to the dashboard.
            ' Range Filter applies filtering to pivot data.
            Dim pivot As PivotDashboardItem = CreatePivot(dataSource)
            dashboardViewer1.Dashboard.Items.Add(pivot)

            ' Reloads data in the data sources.
            dashboardViewer1.ReloadData()
        End Sub
    End Class
End Namespace