Providing Data
- 4 minutes to read
The Dashboard Designer allows you to bind various dashboard items to data in a virtually uniform manner. To learn more, see the Binding Dashboard Items to Data topic.
The only difference is in the data sections that the required dashboard item has. This topic describes how to bind a Range Filter dashboard item to data in the Designer or in code.
Binding to Data in the Designer
The image below shows a sample Range Filter dashboard item that is bound to data.
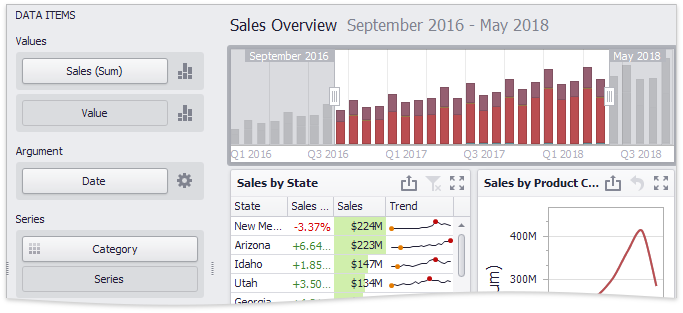
To bind the Range Filter dashboard item to data, drag and drop a data source field to a placeholder contained in one of the available data sections. A table below lists and describes Range Filter data sections.
Section | Processed as | Description |
|---|---|---|
Values | Contains data items against which the Y-coordinates of data points are calculated. | |
Argument | Contains a data item that provides values displayed along the horizontal axis of the Range Filter. Filtering is performed based on these values. Note Note that the Options button (the | |
Series | Contains data items whose values are used to create chart series. |
 icon) allows you to create
 Binding to Data in Code
To provide data for the Range Filter dashboard item, use the following properties.
Argument | |
Series | |
Values | To provide values that determine the Y-coordinate of data points, do the following.
|
Example
Note
The complete sample project How to Bind the Range Filter Dashboard Item to Data in Code is available in the DevExpress Examples repository.
using DevExpress.DashboardCommon;
using System;
// ...
private RangeFilterDashboardItem CreateRangeFilter(IDashboardDataSource dataSource)
{
    // Create a Range Filter dashboard item and specify its data source.
    RangeFilterDashboardItem rangeFilter = new RangeFilterDashboardItem();
    rangeFilter.DataSource = dataSource;
    // Create a new series of the Area type and add this series to the Series collection to
    // display it within the Range Filter.
    SimpleSeries salesAmountSeries = new SimpleSeries(SimpleSeriesType.Area);
    rangeFilter.Series.Add(salesAmountSeries);
    // Specify a measure to provide data used to calculate the Y-coordinate of the data points.
    salesAmountSeries.Value = new Measure("Extended Price");
    // Specify a dimension to provide Range Filter argument values.
    rangeFilter.Argument = new Dimension("OrderDate");
    // Specify a group interval for argument values.
    rangeFilter.Argument.DateTimeGroupInterval = DateTimeGroupInterval.MonthYear;
    // Restrict the displayed data.
    rangeFilter.FilterString = "[OrderDate] > #2018-01-01#";
    // Add predefined ranges to the context menu.
    // You can show the item caption and use the Select Date Time Periods drop-down button to apply predefined ranges.
    rangeFilter.DateTimePeriods.AddRange(
        DateTimePeriod.CreateLastYear(),
        DateTimePeriod.CreateNextMonths("Next 3 Months", 3),
        new DateTimePeriod
        { Name = "Year To Date",
            Start = new FlowDateTimePeriodLimit(DateTimeInterval.Year, 0),
            End = new FlowDateTimePeriodLimit(DateTimeInterval.Day, 1)
        },
        new DateTimePeriod
        { Name = "Jul-18-2018 - Jan-18-2019",
            Start = new FixedDateTimePeriodLimit(new DateTime(2018, 7, 18)),
            End = new FixedDateTimePeriodLimit(new DateTime(2019, 1, 18)) }
        );
    // Specify the period selected when the control is initialized.
    rangeFilter.DefaultDateTimePeriodName = "Year To Date";
    // The caption is initially hidden. Uncomment the line to show the caption.
    //rangeFilter.ShowCaption = true;
    return rangeFilter;
}