Providing Data
- 4 minutes to read
This topic describes how to bind the Pie Map dashboard item to data using the Dashboard Designer, or directly in code.
The Dashboard Designer allows you to bind various dashboard items to data in a virtually uniform manner (see Binding Dashboard Items to Data in the Designer for details). The only difference is in the data sections that these dashboard items have.
Binding to Data in the Designer
The image below shows a sample Pie Map dashboard item that is bound to data.
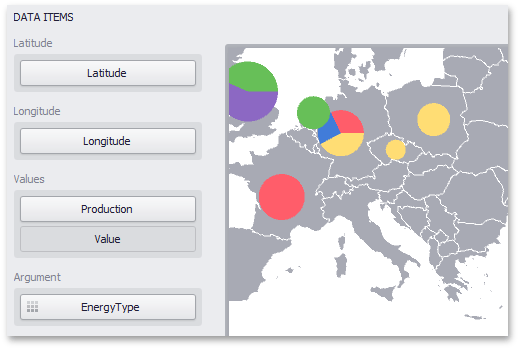
Note that the Pie Map provides two data item groups for data binding: DATA ITEMS and TOOLTIP DATA ITEMS. Tables below list the available data sections.
Data Items
Section | Processed as | Description | API |
|---|---|---|---|
Latitude | Accepts a dimension used to provide geographic latitude. | ||
Longitude | Accepts a dimension used to provide geographic longitude. | ||
Values |
Note In case of negative measure values, Pie Map uses their absolute values. | Accepts measures used to calculate pie values. If you added a data item to the Argument section and several data items to the Values section, you can use the Values drop-down menu to switch between the provided values. To invoke the Values menu, click the | |
Argument | Allows you to provide data for pie arguments. |
 icon in the map’s
 Tooltip Data Items
| Section | Processed as | Description | API |
|---|---|---|---|
| Dimensions | Dimension | Accepts dimensions allowing you to add supplementary content to the tooltips. | GeoPointMapDashboardItemBase.TooltipDimensions |
| Measures | Measure | Accepts measures allowing you to add summaries to the tooltips. | MapDashboardItem.TooltipMeasures |
Example
The following example demonstrates how to bind a Pie Map dashboard item to data in code.
Note
A complete sample project is available at https://github.com/DevExpress-Examples/how-to-bind-a-pie-map-dashboard-item-to-data-in-code-t119627.
using System;
using DevExpress.DashboardCommon;
using DevExpress.DataAccess.ConnectionParameters;
using DevExpress.DataAccess.Sql;
using DevExpress.XtraEditors;

namespace Dashboard_CreatePieMap {
    public partial class Form1 : XtraForm {
        public Form1() {
            InitializeComponent();
        }

        private void Form1_Load(object sender, EventArgs e) {
            // Creates a new dashboard and data source for this dashboard.
            Dashboard dashboard = new Dashboard();

            DashboardSqlDataSource xmlDataSource = new DashboardSqlDataSource();
            xmlDataSource.ConnectionParameters =
                new XmlFileConnectionParameters(@"..\..\Data\DashboardEnergyStatictics.xml");
            SelectQuery sqlQuery = SelectQueryFluentBuilder
                .AddTable("Countries")
                .SelectColumns("Latitude", "Longitude", "Production", "EnergyType", "Country")
                .Build("Query 1");
            xmlDataSource.Queries.Add(sqlQuery);
            dashboard.DataSources.Add(xmlDataSource);

            // Creates a Pie Map dashboard item and specifies its data source.
            PieMapDashboardItem pieMap = new PieMapDashboardItem();
            pieMap.DataSource = xmlDataSource;
            pieMap.DataMember = "Query 1";

            // Loads the map of the europe.
            pieMap.Area = ShapefileArea.Europe;

            // Provides countries coordinates.
            pieMap.Latitude = new Dimension("Latitude");
            pieMap.Longitude = new Dimension("Longitude");

            // Specifies pie values and argument.
            pieMap.Values.Add(new Measure("Production"));
            pieMap.Argument = new Dimension("EnergyType");

            // Specifies values displayed within pie tooltips.
            pieMap.TooltipDimensions.Add(new Dimension("Country"));
            pieMap.Legend.Visible = true;

            // Adds the Pie Map dashboard item to the dashboard and opens this
            // dashboard in the Dashboard Viewer.
            dashboard.Items.Add(pieMap);
            dashboardViewer1.Dashboard = dashboard;
        }
    }
}