Create a Dashboard in the WinForms Designer
- 3 minutes to read
This topic describes how to create a dashboard in the WinForms Dashboard Designer prepared in the Create a WinForms Designer tutorial.
Important
This example uses an Access 97 Database file shipped with the installation package as the data source. If you have Windows x64, make sure that the WinForms Dashboard Designer application is created with its Platform target set to x86.
Steps 1-6. Connect to a Database and Select Data
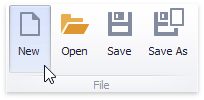
Click New in the Ribbon. This creates a new dashboard and runs the Data Source wizard.
Select Database and click Next on the first page.
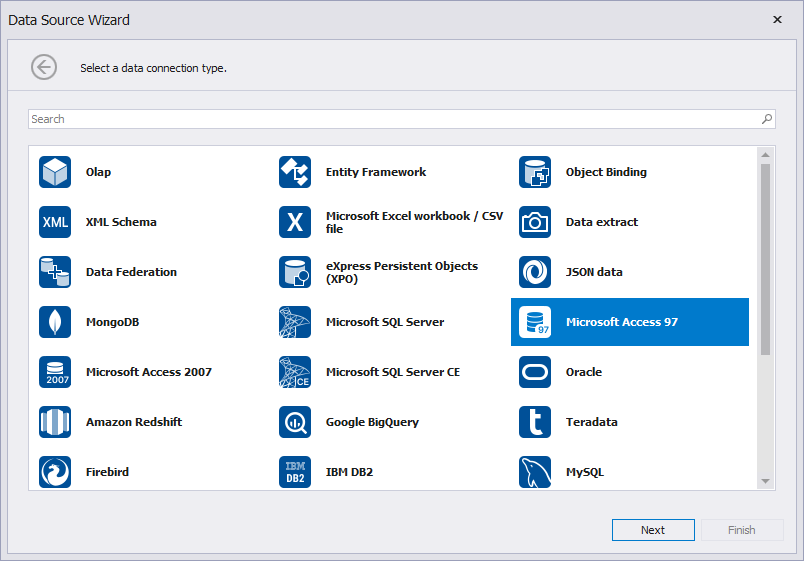
Specify data connection parameters. Select the data provider to Microsoft Access 97 and specify the following path to the database in the Database field:
C:\Users\Public\Documents\DevExpress Demos 26.1\Components\Data\nwind.mdb
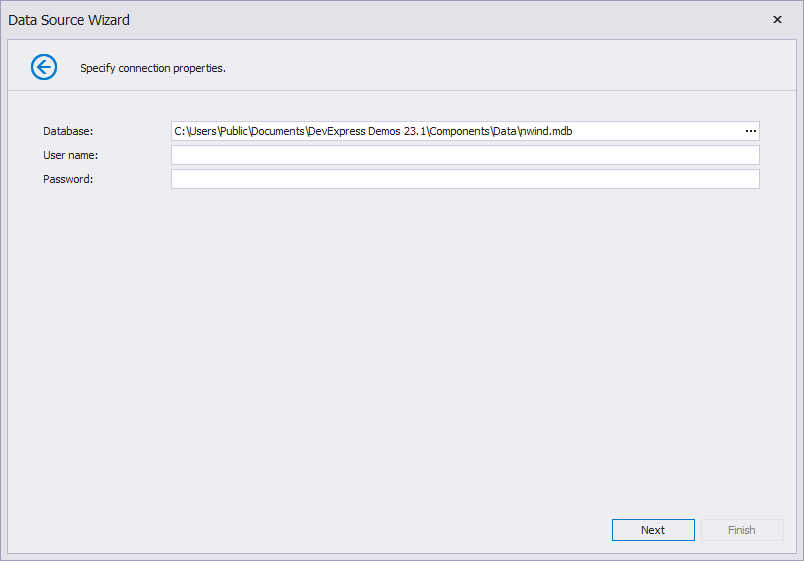
Click Next.
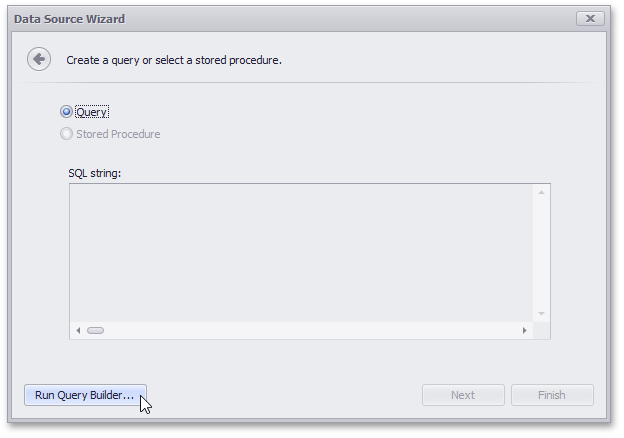
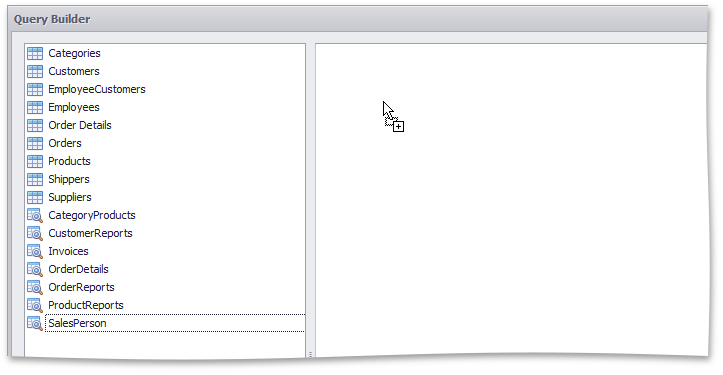
On the final page, click the Run Query Builder… button to run Query Builder.
In the invoked Query Builder, drag and drop the SalesPerson view from Tables Pane on the left to the Design Pane…
…and check the (All Columns) check box.
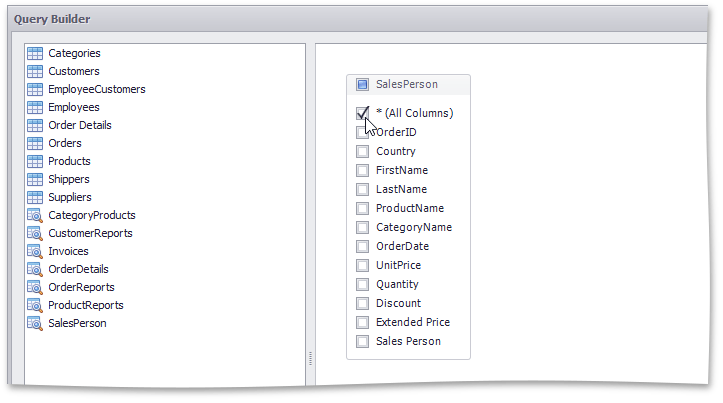
Click OK.
The Data Source Wizard displays the generated query.
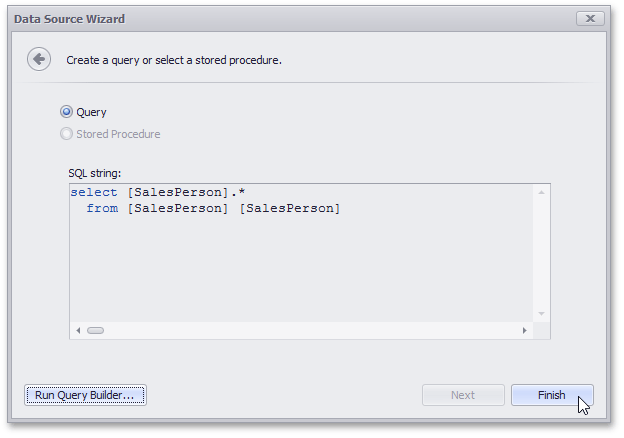
Click Finish to create the data source.
Steps 7-9. Create Dashboard Items and Bind them to Data
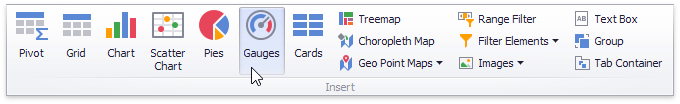
Click the Gauges button in the Ribbon to add gauges.
Drag the Extended Price field from the Data Source Browser to the “Actual” placeholder in the Gauges section.
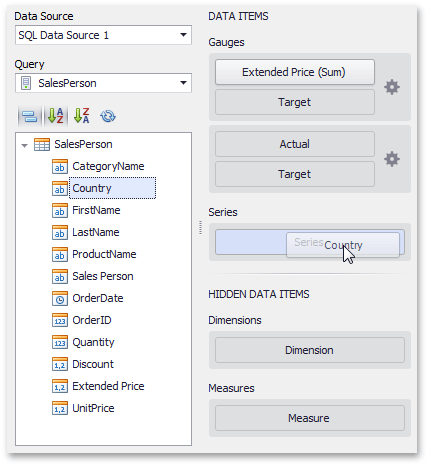
Then, drag the Country field to the Series section.
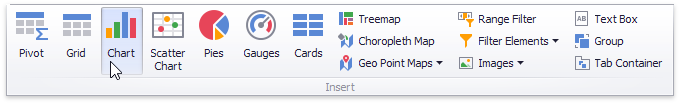
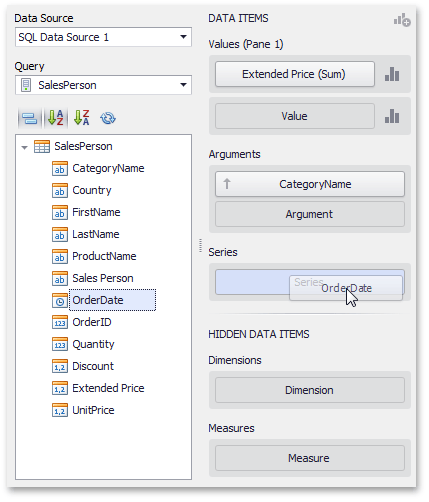
Click the Chart button in the Ribbon to add a chart.
Drag the Extended Price field to the Values section, the CategoryName field to the Arguments section and the OrderDate field to the Series section.
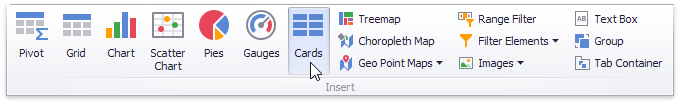
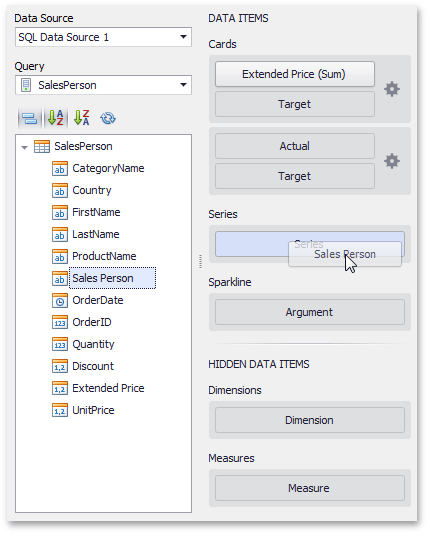
Click the Cards button in the Ribbon to add cards.
Drag the Extended Price field to the “Actual” placeholder in the Cards section. Then, place the Sales Person field in the Series section.
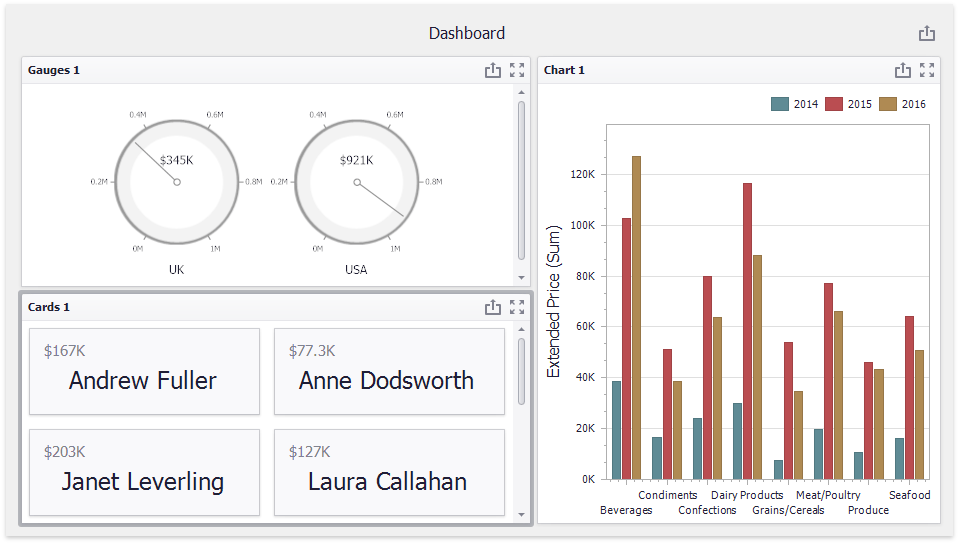
The dashboard looks like this:
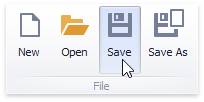
Step 10. Save the Dashboard
Click Save in the Ribbon and select a destination to save the dashboard XML file.
The dashboard is now ready. Refer to tutorials in Build End-User Dashboard Viewer Applications for details on how to embed a dashboard into a Viewer application.
Next Steps
Create Dashboards in the WinForms Designer
Describes how to create and configure dashboards in the WinForms Designer.
-
Describes how to embed the DashboardDesigner control into a WinForms application and how to customize the control’s UI elements.
-
Describes how to prepare the DashboardViewer control to display a dashboard in the WinForms application.