Conditional Formatting
- 5 minutes to read
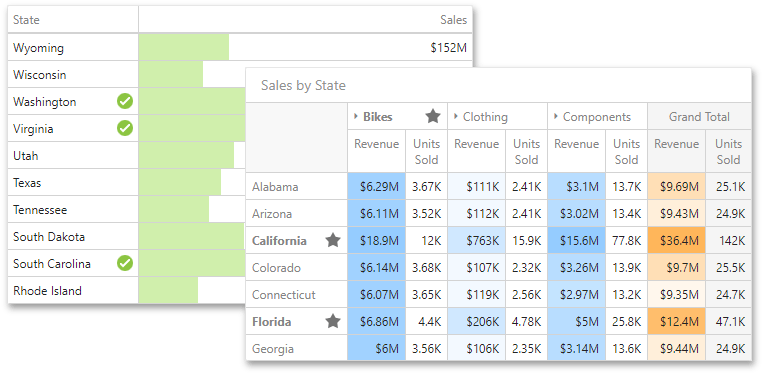
The Web Dashboard control supports conditional formatting. This feature allows you to highlight cell values in the Grid and Pivot Grid that meet the specified criteria.
Format Rules
You can apply format rules to measure or dimension values. The table below lists format rules that can be applied to different types of data items.
Data Item | Supported Format Rules |
|---|---|
string Dimension | Value with the condition type set to Equal To, Not Equal To or Text that Contains |
date-time Dimension |
A Date Occurring for dimensions with the continuous date-time group interval |
Create a Format Rule
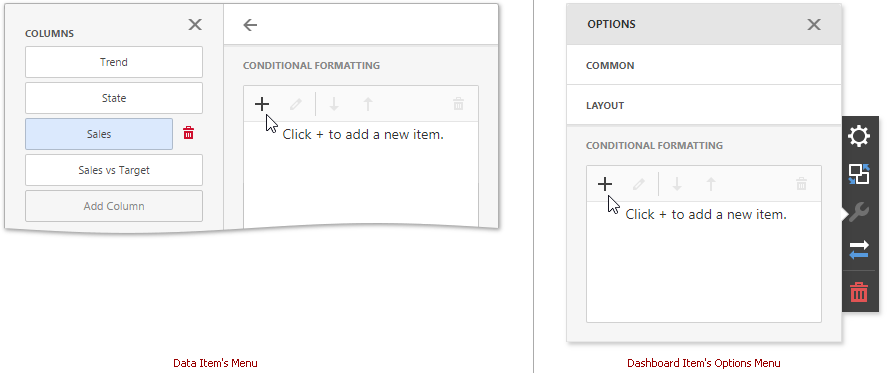
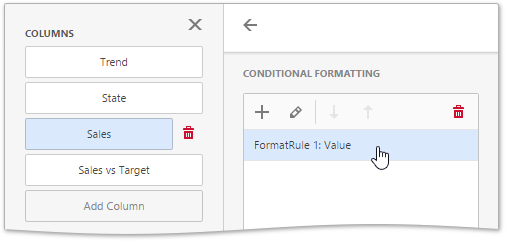
To open the Conditional Formatting section:
- Select the measure/dimension whose values are used to apply formatting and open the data item menu‘s Conditional Formatting section.
- Select a dashboard item, invoke the Options menu, and expand the Conditional Formatting section.
Click “+” to add a new format rule.
Specify the data item used to calculate a condition in the Common section. You can also create a conditional format rule for one data item and apply different settings to the other data item.
Select a formatting rule type from the list to open its settings.
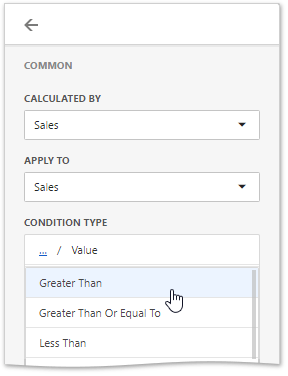
Select a condition from the list and specify its settings in Condition section. Available settings depend on the selected format rule.
Specify additional settings in the Miscellaneous section. For example, you can specify the intersection level for the Pivot or apply the current rule to a row in the Grid.
See the following sections for more information about additional settings:
Edit a Format Rule
To edit a conditional format rule, select the rule and click Edit (![]() ).
).
Click Delete (![]() ) to delete the selected format rule.
) to delete the selected format rule.
Appearance Settings
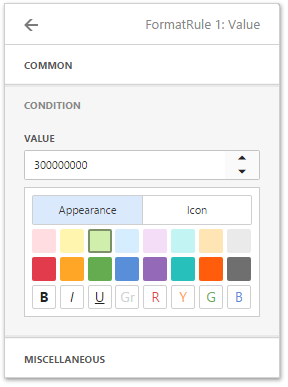
The format rule’s menu Condition section contains appearance settings. You can change predefined conditions’ settings or define new a new appearance for the applied rule.
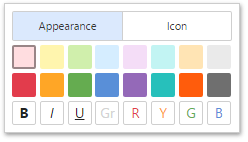
Follow the steps below to specify the Value of the format’s appearance settings:
Choose a predefined background color or font in the Appearance tab.
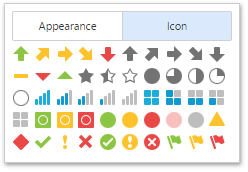
Add a predefined icon in the Icons tab.
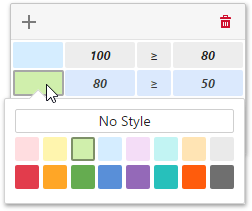
You can customize predefined colors and values for each Range format rule.
Grid Settings
The Grid dashboard item allows you to apply conditional formatting to data items which provide data to the dimension and measure column types.
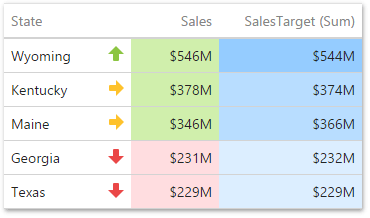
You can use hidden measures to specify a condition used to apply formatting to visible values. New appearance settings are applied to grid cells that correspond to the target dimension/measure values.
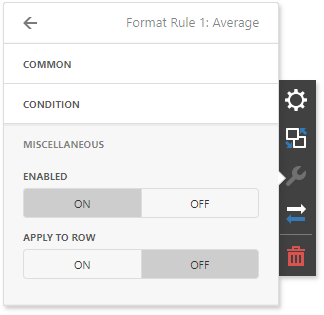
The format rule’s Miscellaneous section contains the following properties that are specific to the Grid item:
| Option | Description |
|---|---|
| Enabled | Enables/ Disables the current format rule. |
| Applied to Row | Applies the current format rule to a row. |
Pivot Settings
The Pivot dashboard item allows you to use conditional formatting for measures in the Values section and dimensions in the Columns/Rows sections.
You can use hidden measures to specify a condition used to apply formatting to visible values. New appearance settings are applied to data cells that correspond to a row/column intersection. You can set a new intersection of the row and column or use predefined settings.
Note the following specifics:
- The dashboard does not calculate conditional formatting in the pivot grid for percentage values on multiple levels. In this case, “All Levels” intersection mode is unavailable.
- If you create a new format rule for a dimension from the Columns/Rows section, the corresponding format condition dialog does not contain any Pivot-specific settings.
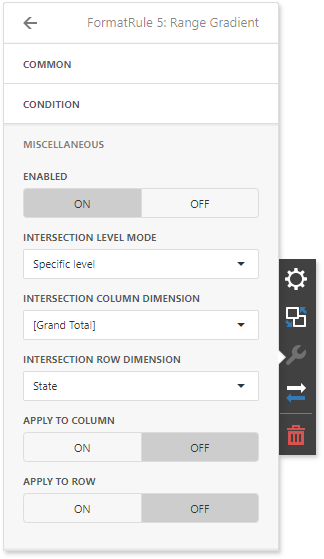
The format rule’s Miscellaneous section contains Pivot-specific options:
| Option | Description |
|---|---|
| Enabled | Enables/ Disables the current format rule. |
| Intersection Mode | Specifies the level on which to apply conditional formatting to pivot cells. |
| Intersection Row/Column Dimension | Applies the format rule to the specified row/column dimension, if you select the Specific Level as the intersection mode. |
| Apply to Row/Column | Specifies whether to apply the formatting to the entire Pivot’s row/column. |
The Pivot item allows you to specify to which field intersection a format rule is applied.
| Intersection Level Mode | Description |
|---|---|
| Auto | Identifies the default level. For the Pivot dashboard item, Auto identifies the First Level. |
| First Level | The first level values are used to apply conditional formatting. |
| Last Level | The last level values are used to apply conditional formatting. |
| All Levels | All pivot data cells are used to apply conditional formatting. |
| Specific Level | The specified measures / dimensions are used to apply conditional formatting. |
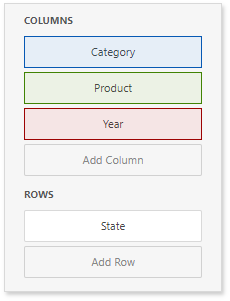
For example, the Pivot item has three fields in the column area (Year, Category, and Product) and one field in the row area (State):
The image below displays different intersection levels with the applied conditional format rule:
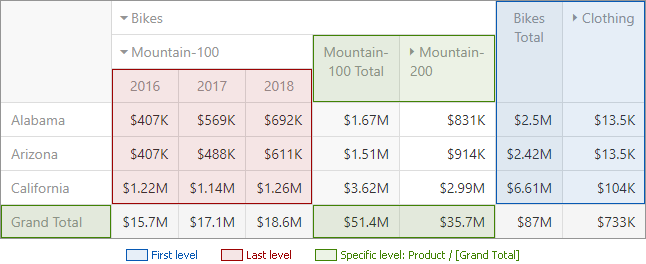
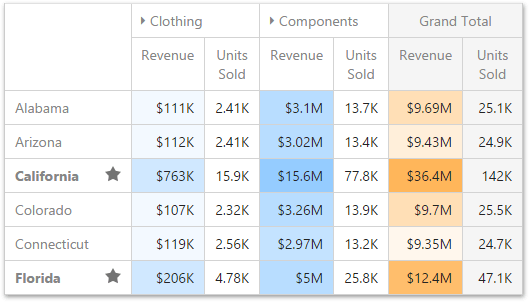
To apply a format rule to the row or column Grand Total, change the Intersection Level Mode to Specific level and set the [Grand Total] value as the intersection row / column dimension.