Conditional Formatting
- 7 minutes to read
The Dashboard Designer control supports conditional formatting. This feature allows you to highlight cell values in the Grid and Pivot Grid that meet the specified criteria.
Format Rules
You can apply conditional formatting to measure or dimension values. The table below lists format conditions that can be applied to different types of data items.
Data Item | Supported Format Conditions |
|---|---|
string Dimension | Value with the condition type set to Equal To, Not Equal To or Text that Contains |
date-time Dimension |
A Date Occurring for dimensions with the continuous date-time group interval |
Create a Format Rule
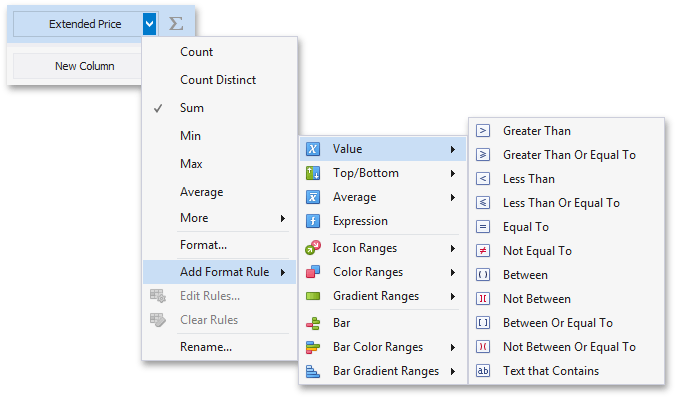
Click the measure/dimension menu button, select Add Format Rule and choose the condition:
Specify appearance settings and set a condition for the format rule. Available settings depend on the selected format rule. The image below displays the Greater Than dialog corresponding to the Value format condition for the Grid dashboard item:
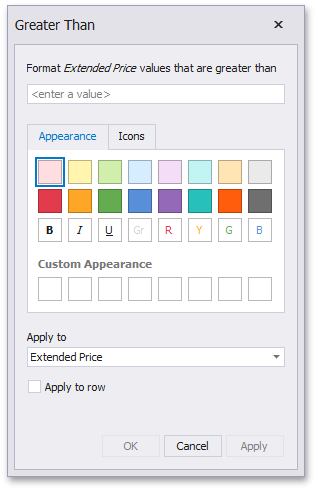
Specify a data item which is used to calculate a condition. You can create a format rule for one data item and apply new appearance settings to the other data item. You can also create format rules for hidden measures and apply formatting to values of visible data items.
Appearance Settings
Follow the steps below to configure and customize the current format condition’s appearance settings:
Choose the predefined background color/font or click an empty square to add a new preset in the Appearance tab.
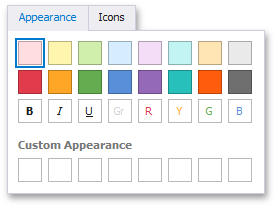
- Add the predefined icon in the Icons tab.
Edit a Format Rule
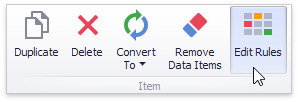
Click the Edit Rules button in the Home ribbon tab to edit format rules for the selected dashboard item:
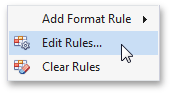
You can also invoke the Edit Rules item in the data item’s menu or in the dashboard item’s context menu:
The Edit Rules dialog contains format rules applied to the dashboard item:
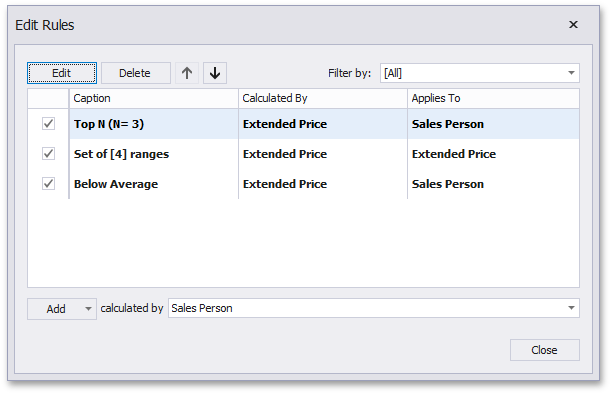
- To edit the selected rule, use the Edit button or double-click the rule.
- To delete the selected rule, use the Delete button.
- To reorder format rules, use the Up (
 and Down (
 buttons. You can reorder rules to specify their priority.
 - To enable/disable a rule, use the corresponding check box in the left column.
- To create a new rule, click the Add button and select the format condition. The calculated by combo box allows you to select the measure/dimension which is used to apply a format rule.
- To filter format rules by the specified data item, use the Filter by combo box.
To clear all rules for the specified data item, use the Clear Rules button in the data item’s context menu.
Grid Settings
The Grid dashboard item applies conditional formatting to data items which provide data to the dimension and measure column types.
You can use hidden measures to specify a condition used to apply formatting to visible values.
The Apply to row check box in the format rule’s dialog specifies whether to apply the formatting to the entire grid row.
Create a Format Rule in Code
Create the GridItemFormatRule object and specify its settings to add a format rule:
- Create a condition (the FormatConditionBase descendant), specify its settings, and assign the resulting object to the DashboardItemFormatRule.Condition property.
- Use the CellsItemFormatRule.DataItem property to specify the condition which is used to check a measure/dimension value. The CellsItemFormatRule.DataItemApplyTo property specifies the measure/dimension to whose values a formatting should be applied.
- Add the created format rule to the GridDashboardItem.FormatRules collection.
Enable the CellsItemFormatRule.ApplyToRow flag to apply formatting to the entire grid row.
You can use the DashboardItemFormatRule.Enabled property to disable the current format rule.
The following code snippet shows how to apply the Top-Bottom (FormatConditionTopBottom) format condition to highlight the three topmost values:
GridItemFormatRule topRule = new GridItemFormatRule(extendedPrice, salesPerson);
FormatConditionTopBottom topCondition = new FormatConditionTopBottom();
topCondition.TopBottom = DashboardFormatConditionTopBottomType.Top;
topCondition.RankType = DashboardFormatConditionValueType.Number;
topCondition.Rank = 3;
topCondition.StyleSettings = new IconSettings(FormatConditionIconType.IndicatorGreenCheck);
topRule.Condition = topCondition;

grid.FormatRules.Add(topRule);
Tip
Refer to the Conditional Formatting section for more examples.
Pivot Settings
The Pivot dashboard item applies conditional formatting to measures placed in the Values section and dimensions placed in the Columns or Rows sections.
You can use hidden measures to specify a condition used to apply formatting to visible values.
The format rule’s dialog contains the following Pivot-specific settings:
| Option | Description |
|---|---|
| Enabled | Enables/ Disables the current format rule. |
| Intersection Mode | Specifies the level on which to apply conditional formatting to pivot cells. |
| Intersection Row/Column Dimension | Applies the format rule to the specified row/column dimension, if you select the Specific Level as the intersection mode. |
| Apply to Row/Column | Specifies whether to apply the formatting to the entire Pivot’s row/column. |
The Pivot item allows you to specify to which field intersection a format rule is applied.
| Intersection Level Mode | Description |
|---|---|
| Auto | Identifies the default level. For the Pivot dashboard item, Auto identifies the First Level. |
| First Level | The first level values are used to apply conditional formatting. |
| Last Level | The last level values are used to apply conditional formatting. |
| All Levels | All pivot data cells are used to apply conditional formatting. |
| Specific Level | The specified measures / dimensions are used to apply conditional formatting. |
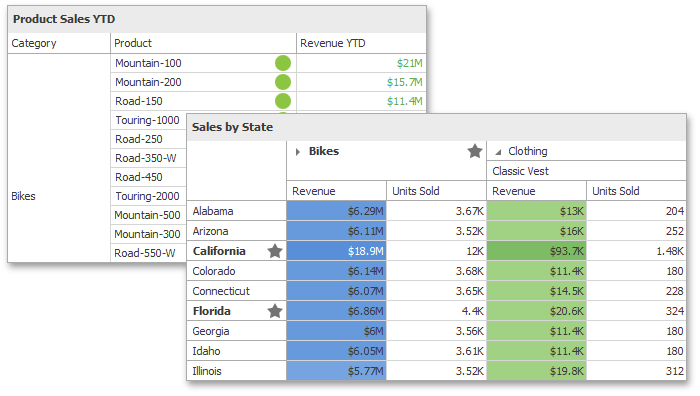
The image below displays different intersection levels with the applied conditional format rule:
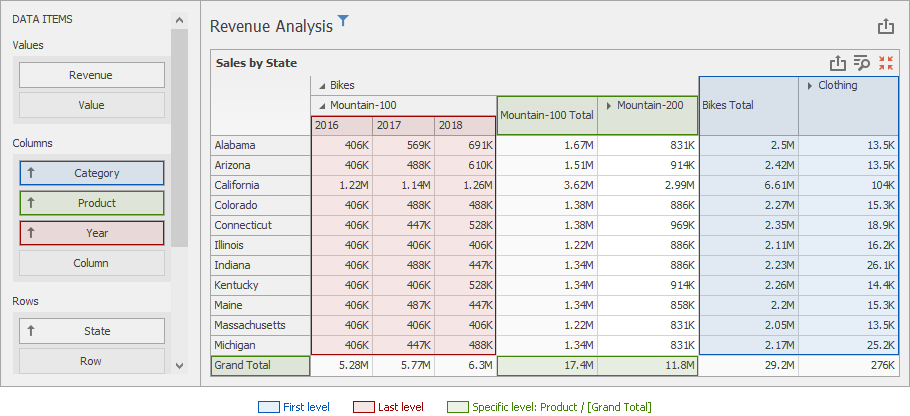
To apply a format rule to the row or column Grand Total, change the Intersection Level Mode to Specific level and set the [Grand Total] value as the intersection row/column dimension.
Note the following limitations:
- The dashboard cannot calculate conditional formatting in the Pivot Grid for multiple levels for ranges with percentage values. In this case, the “All Levels” intersection mode is not available for a conditional formatting rule.
- The format condition dialog does not contain any Pivot-specific settings for a dimension from Columns and Rows.
Create a Format Rule in Code
Create the PivotItemFormatRule object and specify its settings to add a format rule:
- Create a condition (FormatConditionBase descendant), specify its settings, and assign the resulting object to the DashboardItemFormatRule.Condition property.
- Assign a data item (measure/dimension) which values are used to calculate the condition to the CellsItemFormatRule.DataItem property. To apply the format rule to a measure/dimension to whose values conditional formatting is applied, use the CellsItemFormatRule.DataItemApplyTo property. If this property is not specified, the control applies formatting to the CellsItemFormatRule.DataItem value.
- Use the PivotItemFormatRule.IntersectionLevelMode property to specify the intersection level. If the PivotItemFormatRule.IntersectionLevelMode property is set to FormatConditionIntersectionLevelMode.SpecificLevel, use the PivotItemFormatRule.Level property to set the intersection’s row and column fields.
- Add the created format rule to the GridDashboardItem.FormatRules collection.
Enable the CellsItemFormatRule.ApplyToRow/PivotItemFormatRule.ApplyToColumn properties to apply formatting to the entire pivot row/column.
You can use the DashboardItemFormatRule.Enabled property to disable the current format rule.
The following code snippet shows how to apply the Top-Bottom (FormatConditionTopBottom) format condition to highlight three topmost values:
PivotItemFormatRule lastLevelRule = new PivotItemFormatRule(pivot.Values[0]);
FormatConditionRangeGradient rangeCondition =
    new FormatConditionRangeGradient(FormatConditionRangeGradientPredefinedType.WhiteGreen);
lastLevelRule.Condition = rangeCondition;
lastLevelRule.IntersectionLevelMode = FormatConditionIntersectionLevelMode.LastLevel;

PivotItemFormatRule topCategoryRule = new PivotItemFormatRule(pivot.Values[0]);
FormatConditionTopBottom topCondition = new FormatConditionTopBottom();
topCondition.TopBottom = DashboardFormatConditionTopBottomType.Top;
topCondition.RankType = DashboardFormatConditionValueType.Number;
topCondition.Rank = 3;
topCondition.StyleSettings = new IconSettings(FormatConditionIconType.RatingFullGrayStar);
topCategoryRule.Condition = topCondition;
topCategoryRule.IntersectionLevelMode = FormatConditionIntersectionLevelMode.SpecificLevel;
topCategoryRule.Level.Row = pivot.Rows[0];
topCategoryRule.DataItemApplyTo = pivot.Rows[0];

pivot.FormatRules.AddRange(lastLevelRule, topCategoryRule);
Tip
Refer to the Conditional Formatting section for more examples.