HeatmapPaletteColorProvider.Palette Property
Gets or sets the color provider palette.
Namespace: DevExpress.XtraCharts.Heatmap
Assembly: DevExpress.XtraCharts.v21.2.dll
NuGet Package: DevExpress.Charts
Declaration
Property Value
| Type | Description |
|---|---|
| Palette | Specifies the color provider palette. |
Remarks
You can use one of the predefined palettes to specify the Palette property:
It is possible to create a custom palette as follows:
colorProvider.Palette = new Palette("Custom") { Color.White, Color.SkyBlue, Color.DarkBlue };
Alternatively, you can use the PaletteName property to specify the palette.
Example
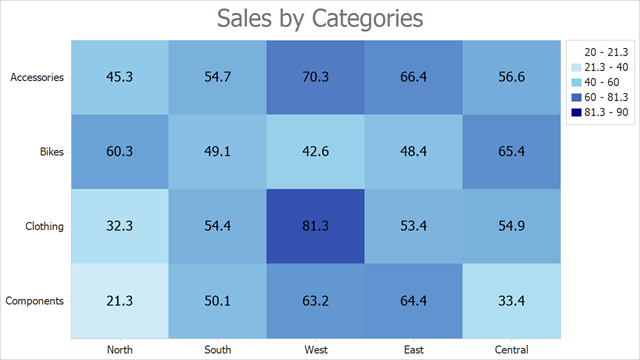
This example shows how to use arrays of string and numeric values to create a heatmap:
Follow the steps below to create a heatmap:
- Add the HeatmapControl to the Form.
- Create a HeatmapMatrixAdapter object and assign it to the HeatmapControl.DataAdapter property.
- Use the adapter’s XArguments and YArguments properties to populate the heatmap with x- and y-arguments that are displayed along x- and y-axes.
- Assign a two-dimensional array of double values to the adapter’s Values property.
- Create a HeatmapRangeColorProvider object and assign it to the heatmap’s ColorProvider property. The HeatmapRangeColorProvider paints cells based on the value range to which the cell value belongs.
- Add a HeatmapTitle to the heatmap’s Titles collection. Specify the title’s Text property.
- Use the heatmap’s Label property to configure cell label options. This example shows how to configure label text format.
using DevExpress.XtraCharts;
using DevExpress.XtraCharts.Heatmap;
using System.Drawing;
using System.Windows.Forms;

namespace HeatmapMatrixData {
    public partial class Form1 : Form {
        public Form1() {
            InitializeComponent();

            HeatmapMatrixAdapter dataAdapter = new HeatmapMatrixAdapter();
            dataAdapter.XArguments = new string[] { "North", "South", "West", "East", "Central" };
            dataAdapter.YArguments = new string[] { "Components", "Clothing", "Bikes", "Accessories" };
            dataAdapter.Values = new double[,] {
                { 21.3, 50.1, 63.2, 64.4, 33.4 },
                { 32.3, 54.4, 81.3, 53.4, 54.9 },
                { 60.3, 49.1, 42.6, 48.4, 65.4 },
                { 45.3, 54.7, 70.3, 66.4, 56.6 }
            };
            heatmap.DataAdapter = dataAdapter;

            Palette palette = new Palette("Custom") {
                Color.White,
                Color.SkyBlue,
                Color.DarkBlue
            };

            HeatmapRangeColorProvider colorProvider = new HeatmapRangeColorProvider() {
                Palette = palette,
                ApproximateColors = true
            };
            colorProvider.RangeStops.Add(new HeatmapRangeStop(0, HeatmapRangeStopType.Percentage));
            colorProvider.RangeStops.Add(new HeatmapRangeStop(20, HeatmapRangeStopType.Absolute));
            colorProvider.RangeStops.Add(new HeatmapRangeStop(40, HeatmapRangeStopType.Absolute));
            colorProvider.RangeStops.Add(new HeatmapRangeStop(60, HeatmapRangeStopType.Absolute));
            colorProvider.RangeStops.Add(new HeatmapRangeStop(90, HeatmapRangeStopType.Absolute));
            colorProvider.RangeStops.Add(new HeatmapRangeStop(1, HeatmapRangeStopType.Percentage));

            heatmap.ColorProvider = colorProvider;

            heatmap.Titles.Add(new HeatmapTitle { Text = "Sales by Categories" });

            heatmap.Label.Visible = true;
            heatmap.Label.Pattern = "{V}";
        }
    }
}
See Also